
Dog fitness is trending. Amazon's data tells a more complicated story
Treadmills, GPS collars, joint chews and puzzle toys for dogs are everywhere on social media right now. We checked what's real against Amazon's own search data, live product pages, and actual customer reviews.
By Alex Tkach, CEO & Co-Founder, UNITIX Agency
See more UNITIX in Google
Add UNITIX to your Preferred Sources.
Dog treadmills, GPS collars that track steps, joint chews, and puzzle toys that double as exercise equipment are everywhere on social media right now. Industry researchers call pet wearables one of the fastest-growing retail categories of 2026, and retail analysts have gone as far as predicting the niche will "dominate" sales. We checked what's actually happening on Amazon: real search data, real product pages, real reviews.
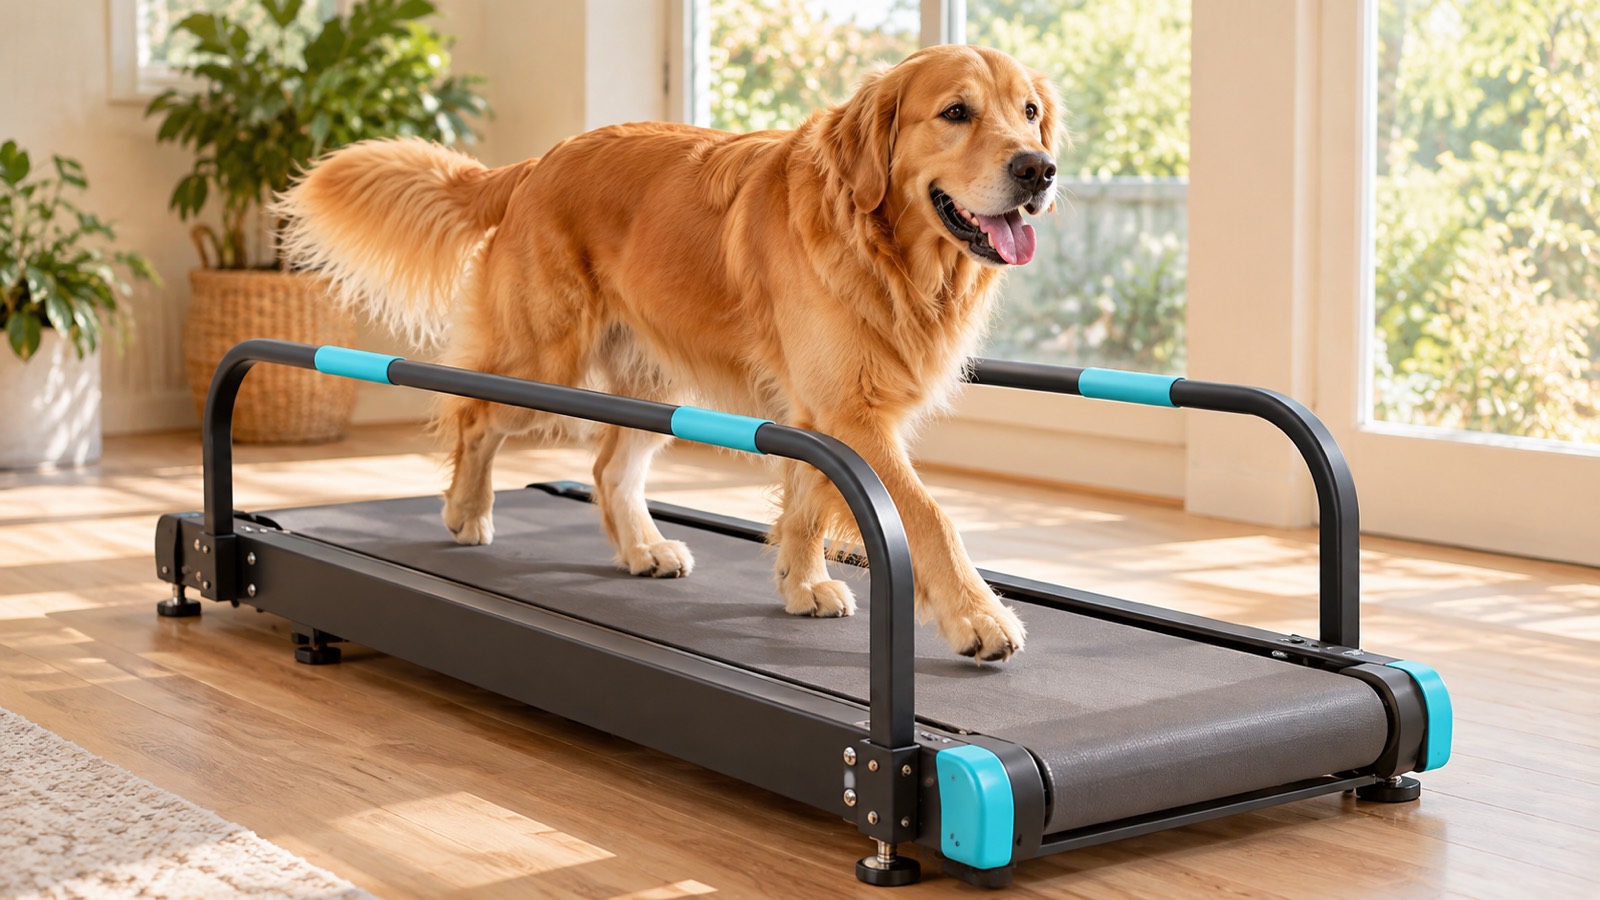
The 30-second answer
The data doesn't support one broad "dog fitness boom." Interactive toys combine the strongest search demand with the cheapest clicks in this article ($0.75-1.33 CPC). Supplements have the most open competition but the highest cost per click (up to $9.13), so "open" isn't the same as "cheap." Treadmills carry the clearest warning: demand down 24-35% by two separate tools, confirmed independently, not a rounding error in one export. The full case for each, with sources, is below.
One number worth correcting first
A figure circulating online puts the "pet fitness and wellness market" at "$150+ billion." We checked it against Grand View Research, Research and Markets, and Fortune Business Insights, and couldn't find it in any of them. The likely source of the confusion: the entire pet products market is $165.6 billion in 2026, projected to reach $483.5 billion by 2035 at a 7.1% CAGR. That's close to "$150 billion," it's just the whole pet industry, not the fitness niche inside it. The fitness niche itself is smaller: pet fitness care is $7-8.6 billion, dog treadmills specifically are $100-120 million, pet wearables are $4.1 billion (14% CAGR), and dog supplements are $3.3 billion. The trend is real and well documented, just at more modest numbers than the viral figure suggests.
What people actually search for
Below is data read directly from Amazon's own Brand Analytics search terms report, US marketplace, July 2026. Search Frequency Rank is the term's rank among every search on Amazon: the lower the number, the higher the demand. For scale, "dog collar," an ordinary collar, ranks 791, one of the most-searched phrases on the platform overall.
| Search term | Search Frequency Rank | Top-1 click share | Top-1 purchase share |
|---|---|---|---|
| dog collar (for scale) | 791 | — | — |
| interactive dog toys | 10,038 | 6.4% | 4.2% |
| dog puzzle toy | 16,152 | 14.0% | 13.0% |
| dog vitamins | 24,790 | 15.4% | 8.8% |
| dog joint supplement | 29,035 | 17.6% | 13.6% |
| dog treadmill | 38,839 | 18.3% | 0%* |
| dog tracker | 48,577 | 12.9% | 4.0% |
| dog cbd | 47,445 | 18.3% | 14.7% |
| dog supplements | 53,813 | 8.8% | 4.2% |
| dog agility equipment | 100,037 | 10.4% | 5.4% |
| dog gps tracker | 179,499 | 14.1% | 18.5% |
* The top-clicked ASIN for "dog treadmill" shows 0% purchase share in the report. Most likely this means shoppers click that listing but complete the purchase on a different size or variant of the same product, which the underlying report can see but this table can't isolate.
"Interactive dog toys" is the single highest-ranked, highest-demand term in this whole set, well ahead of treadmills, trackers and supplements individually. Search Frequency Rank is an ordering, not a volume, so it can be compared term to term but never summed across terms.
What it actually costs to compete for a click
Search demand and click concentration say who's winning attention. They say nothing about what winning it costs. We pulled Helium 10's suggested bid range for the same ten terms:
| Search term | Suggested CPC (min–max) | Search volume trend |
|---|---|---|
| interactive dog toys | $0.75–$1.33 | +7% |
| dog puzzle toy | $0.90–$1.77 | −4% |
| dog treadmill | $1.00–$1.68 | −24% |
| dog agility equipment | $0.60–$1.33 | −11% |
| dog gps tracker | $1.43–$3.39 | −14% |
| dog tracker | $1.20–$3.40 | −5% |
| dog cbd | $2.37–$4.15 | +1% |
| dog vitamins | $3.10–$6.15 | +3% |
| dog supplements | $3.34–$7.48 | 0% |
| dog joint supplement | $4.00–$9.13 | −3% |
Two things this changes about the earlier picture. First, "open" and "cheap to enter" are not the same thing: dog supplements had the lowest click concentration of any category in this article, the combined share held by the three most-clicked listings Amazon names for a query, a broader measure than the single leader's share used in the table above, at 19% (the most room for a new brand), and also the highest cost per click of the group, $3.34-$7.48. A fragmented market still means bidding against everyone else trying to fragment it further.
Second, an uncomfortable number: search volume for "dog treadmill" is down 24% against Helium 10's trend window, the steepest drop of any term here, treadmill or otherwise. Toys, meanwhile, keep climbing: "interactive dog toys" is up 7%. We'd rather report that plainly than quietly drop the one number that complicates the trend story. It doesn't mean the treadmill niche is dying, a small, oversize-shipped category is naturally noisier month to month, but it's a real reason to weight a launch decision toward toys or supplements over treadmills specifically, not just toward "dog fitness" as a whole.
On top of cost per click, treadmills carry a second cost the smaller products in this list don't: Amazon's own 2026 Large Bulky fulfillment fees start at $8.58-9.35 plus $0.38 per pound above the first pound, and anything over 96 inches on its longest side adds a further $17-25 Overmax surcharge. A treadmill that ships assembled or in one long box is a materially different fulfillment cost than a bottle of supplements or a puzzle toy, on top of the higher price tag.
Returns, and a second tool confirming the same decline
We pulled Amazon's own Product Opportunity Explorer for the three niches with the cleanest match to our search terms, a second, independent data source from the one behind the search-rank table above:
| Niche (Explorer's own name) | Search volume (360 days) | Growth (180 days) | Return rate | Avg. price |
|---|---|---|---|---|
| dog treadmill | 974,518 | −35.3% | 3.58% | $474.49 |
| gps tracker for dogs | 1,408,319 | −12.9% | 1.89% | $58.71 |
| dog vitamins | 3,152,644 | +8.4% | 0.01% | $21.81 |
| senior dog supplements | 224,175 | +2.6% | 0.33% | $22.56 |
Two things worth stating plainly. The treadmill decline isn't a one-tool artifact: Explorer's own growth figure, on a completely different metric and time window than Helium 10's, is even steeper, −35.3% against −24%. Two independent sources agree on the direction. Return rates also differ sharply by product type: 3.58% for treadmills and 1.89% for GPS trackers, against 0.01% and 0.33% for the two supplement niches. With only four niches and very different product types, physically complex treadmills, electronics, consumables, this is worth noting as a descriptive pattern, not evidence that market concentration itself drives returns.
The second thing is less tidy, and we're reporting it rather than smoothing it over. Explorer's own broader "dog toys" niche (43.5 million in search volume) is also down sharply, −38.0% over 180 days, which sits uneasily next to Helium 10's +7% for the narrower "interactive dog toys" term. The two tools aren't measuring identically scoped things, "dog toys" is a much wider basket than "interactive dog toys," so the honest read is that broad, commodity dog toys may be cooling while the specific interactive/puzzle mechanic keeps growing inside that shrinking whole, not that one of the two numbers is simply wrong. We'd rather leave that tension visible than pick whichever figure supports a cleaner story.
Treadmills: one clear leader, with a real weak point
The top-clicked ASIN for "dog treadmill" in our own data is B0B7KY7WCH, made by PawPaw's, a small Canadian company. Amazon backs this up independently: there's a dedicated Dog Treadmills category inside Pet Supplies → Dogs → Training & Behavior Aids → Agility Equipment. PawPaw's alone holds 18.3% of clicks on the core search term, and together with the next two most-clicked listings, 44% goes to just three products. That's a concentrated market; a new seller needs a real point of difference, not "the same thing, from us."
"First, I will say my dog loves this slatmill and uses it daily... Now for the not so great. This is a prime example of great idea with just ok execution. The parts were not manufactured to be the exact size as needed, I had to bend some of the parts to get them to fit correctly. Also the instructions are not only lacking but also flat out wrong at times." — 4-star Verified Purchase
"This is a sturdy machine for our dog. Our dogs need a high level of exercise every day. I would highly recommend this product." — 5-star Verified Purchase
The honest picture: dogs use it and their owners like the exercise it provides, but assembly and instructions are a real weak point, even for the category leader. That's not just a warning for shoppers, it's a specific, checkable opening for a competitor.
What's actually on that first page of results for "dog treadmill" right now, saved 30 September 2026:
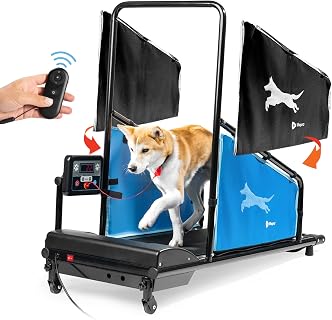
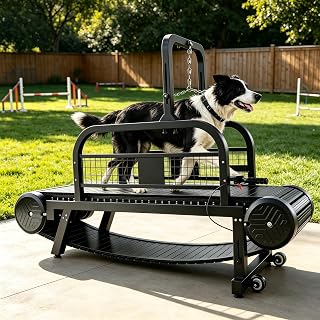
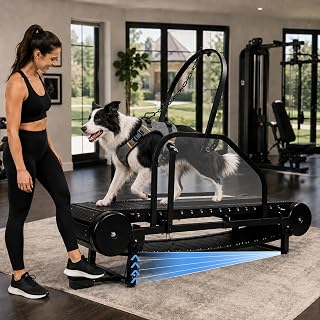
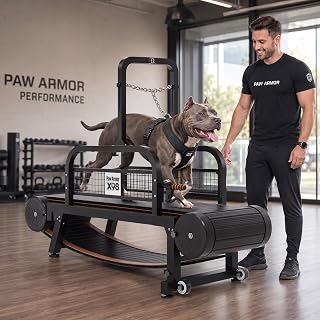
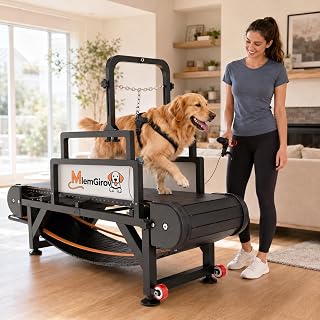
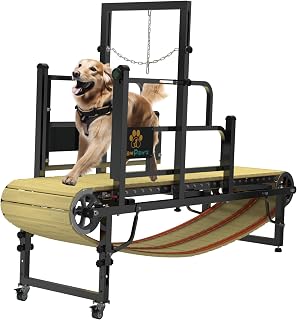
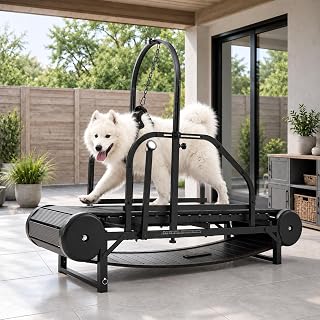
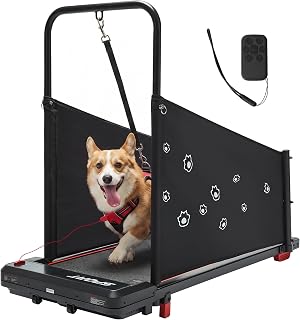
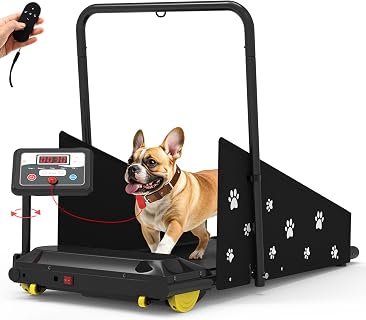
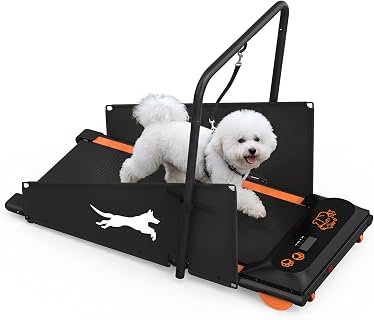
One honest wrinkle: Lifepro PawRunner has more total ratings than PawPaw's, 261 against 90. That doesn't contradict PawPaw's lead above, click share and accumulated review count are different measures, one current, one cumulative, but it's a real reminder that "the top-clicked ASIN in our data" describes right now, not a permanent rank.
GPS trackers: smaller demand, an unusually strong purchase signal

The top-clicked ASIN for "dog tracker" is B0BLXHWPLP, Ring Pet Tag, a $29.99 QR-code tag with scan alerts and a shareable pet profile, no GPS and no subscription.
"Easy to set up. Not heavy or 'clanky'. Every pet should have one. A very inexpensive way to give yourself peace of mind and a chance to recover your lost pet." — 5-star Verified Purchase
The broader "dog gps tracker" search behaves differently: the top result's purchase share (18.5%) is higher than its click share (14.1%), meaning that listing captures a disproportionately high share of purchases relative to its share of clicks, a sign of strong post-click performance or brand preference, not a directly measured conversion rate. A recognizable name in true GPS tracking is Fi Smart Collar (B0FH8HQS3V), priced around $149 plus a $99/year subscription after a free month, tracking location, steps and sleep. We didn't save Fi's own page directly, so its pricing here is from a secondary search, flagged as such rather than presented as independently verified. The pet wearables market as a whole is valued at $4.1 billion in 2026, projected to $10.4 billion by 2033 (14% CAGR), and dogs already account for nearly 60% of it. In March 2026, uCloudlink showed PetPhone at Mobile World Congress Barcelona, an AI-and-GPS collar that alerts owners to a sudden drop in a pet's activity, a sign the category interests large tech players, not only startups.
What's actually on that first page of results for "dog gps tracker" right now, saved 30 September 2026:
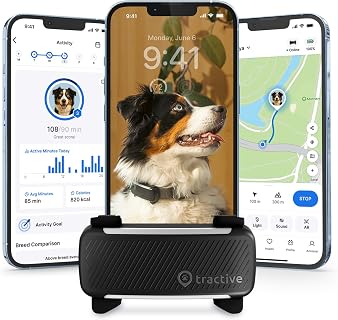
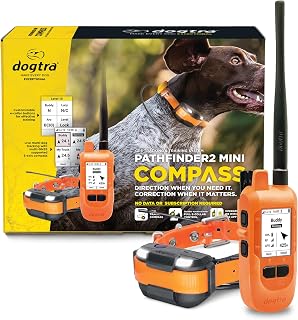
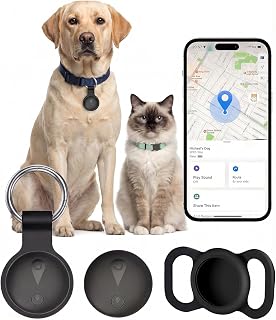
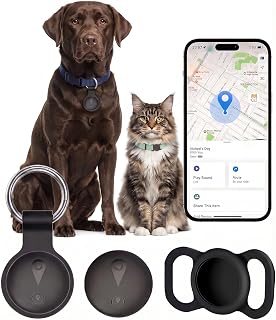
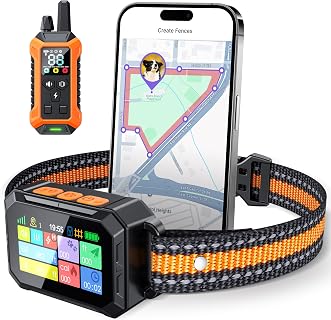
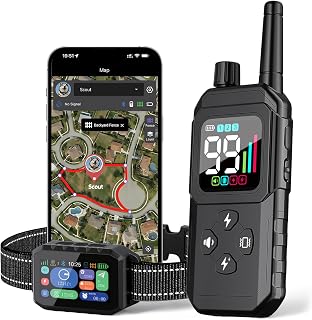
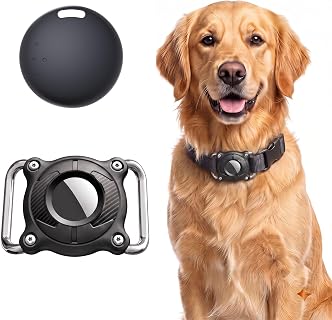
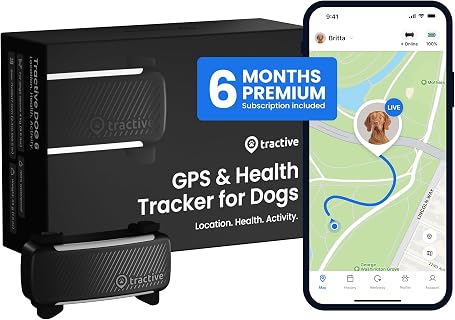
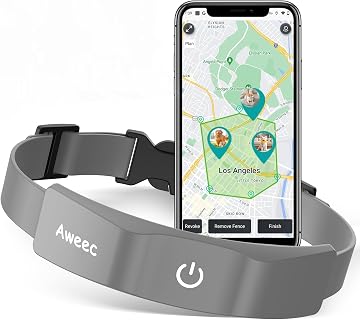
Worth noting honestly: most of this specific page is GPS wireless fences and training-collar systems, not the step-tracking fitness wearables the trend coverage implies, and every listing carrying a review count over a few hundred is a paid placement, not an organic ranking. Ring Pet Tag, the real organic leader for the narrower "dog tracker" term above, doesn't appear on this broader page at all, another sign these are two different searches with two different answers, not one category with one winner.
Toys: the biggest demand of all

"Interactive dog toys" ranks 10,038, higher demand than treadmills, trackers, supplements and agility equipment each on its own. The logic matches what's driving the toy side of this trend generally: getting a treat out of a toy is itself exercise, and a whole line of refill treats and puzzle variants builds around that one idea. "Dog puzzle toy" (rank 16,152) is unusual: its top result's purchase share (13.0%) is nearly identical to its click share (14.0%), usually a sign of a strong, recognized product rather than a listing shoppers keep comparing away from. "Dog cbd" (rank 47,445) is a different story: its three most-clicked listings together hold 39.9% of clicks, the highest three-listing concentration in this entire set (its single leader holds 18.3% alone), meaning that market, unlike ordinary supplements, is already largely decided.
What's actually on that first page of results right now, real listings, real prices, saved 30 September 2026:
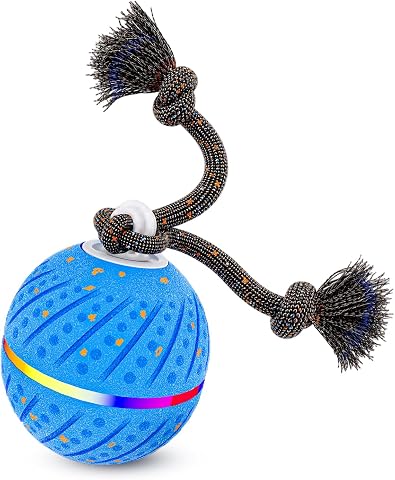
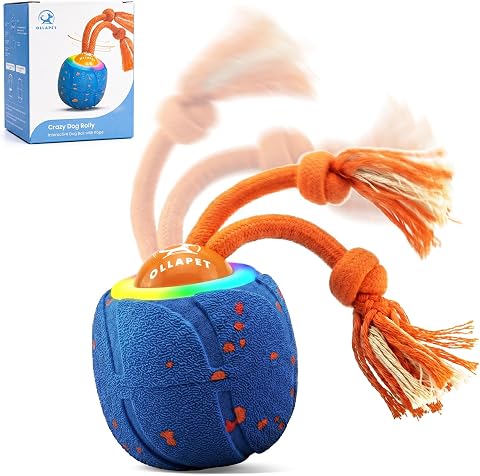
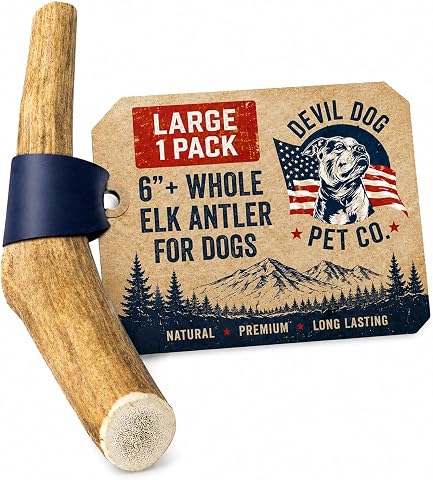
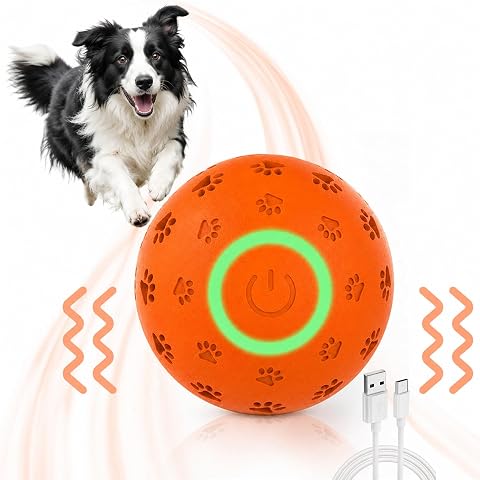
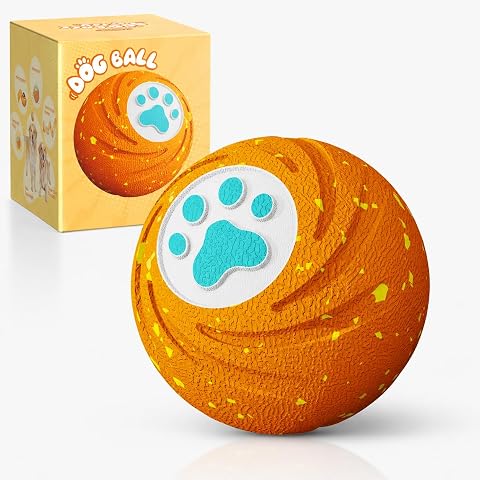
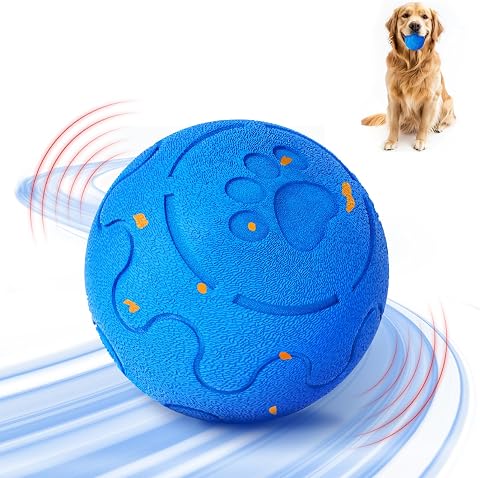
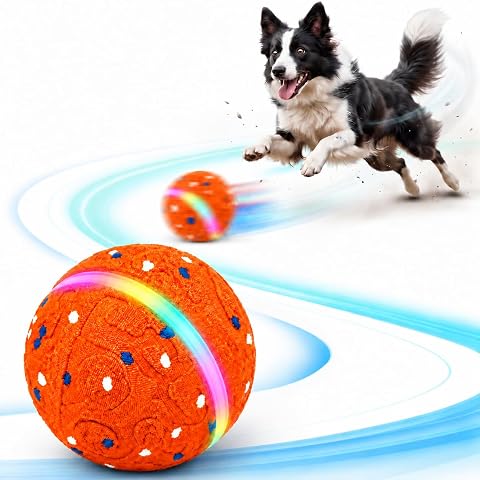
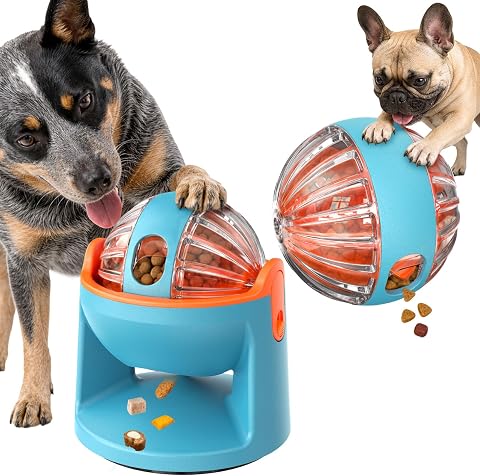
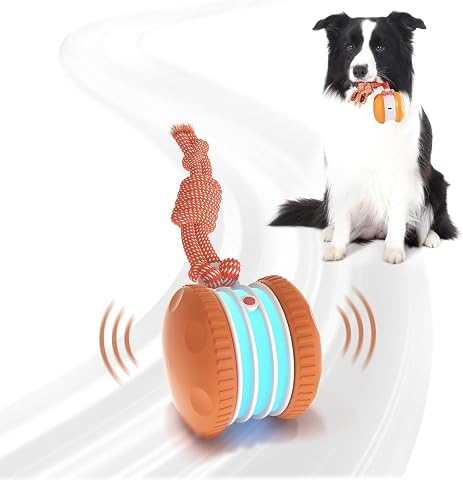
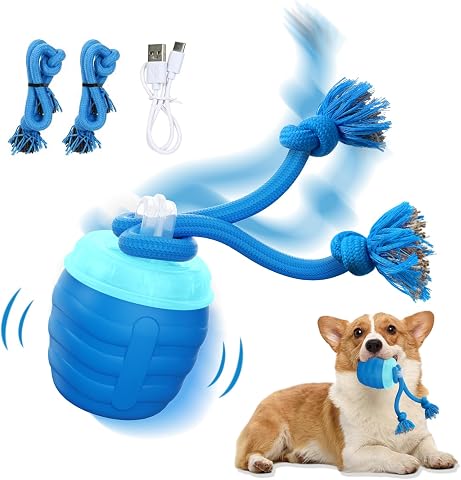
Click through and one of these, B0DK42TDSK, is not a random inclusion: it's the same ASIN that shows up as the #2 most-clicked listing for "interactive dog toys" in our own Brand Analytics export earlier in this piece, now independently confirmed still ranking on the live results page two months later.
Supplements: the most open category of the group
The three most-clicked listings for "dog supplements" together hold only 19% of clicks, the lowest concentration in the group (the single leader holds under 9% alone), meaning shoppers compare actively and no single brand has locked the category down. That tracks with a separate, current data point straight from Amazon: during Amazon Pet Days 2026, dog supplement brands posted some of the largest share gains of any pet category. Native Pet grew 2.5 percentage points; Zesty Paws grew 0.9. We checked both brands' own product pages directly.
"Started adding this Native Pet Wild Alaskan Salmon Oil to my dog's food a few weeks ago and the results have been clear. His coat is softer, shinier, and he's scratching a lot less than before." — 5-star Verified Purchase
"My husky absolutely loves them. We take our vitamins in the morning, and this has become his vitamin so he feels included in the routine. He gets genuinely excited for them." — 5-star Verified Purchase
Native Pet and Zesty Paws are two names, not the whole shelf. What else shows up on the first page for "dog supplements" right now, saved 30 September 2026:
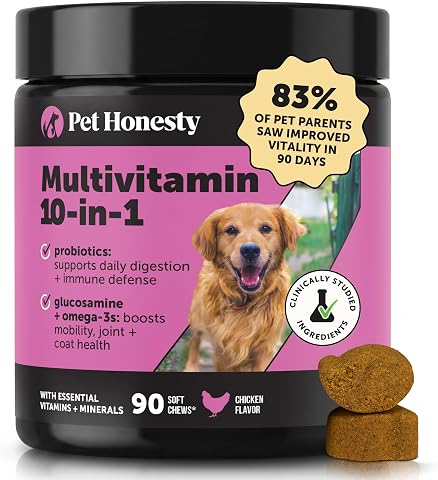
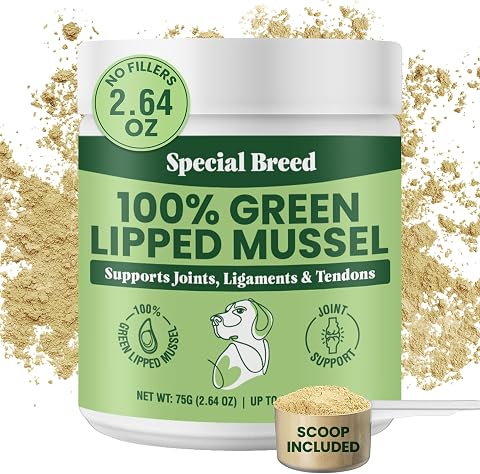
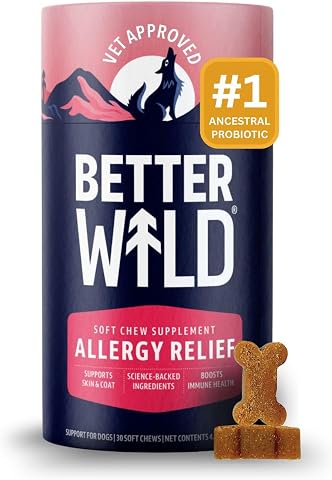
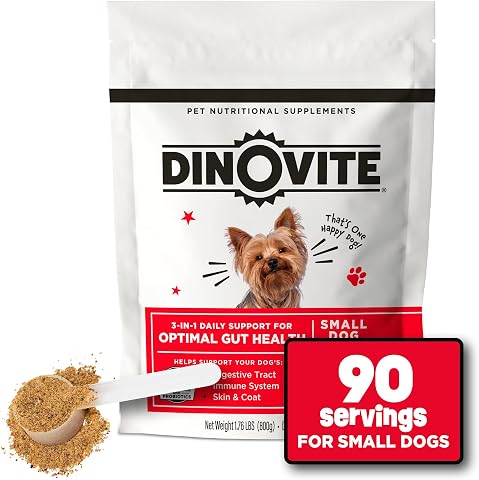
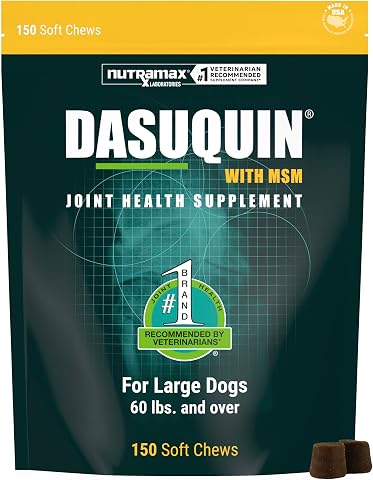
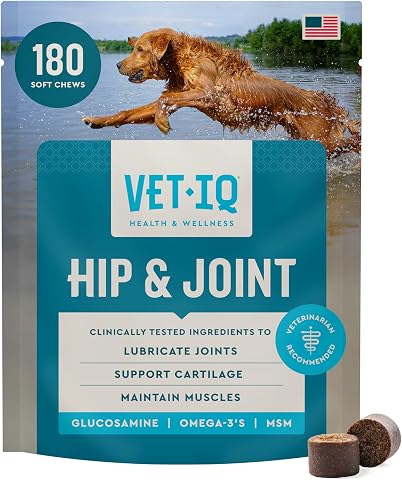
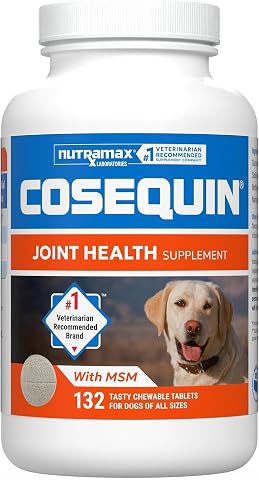
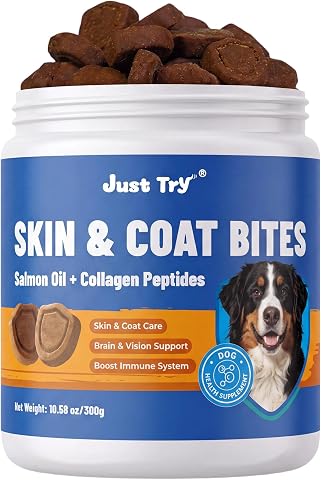
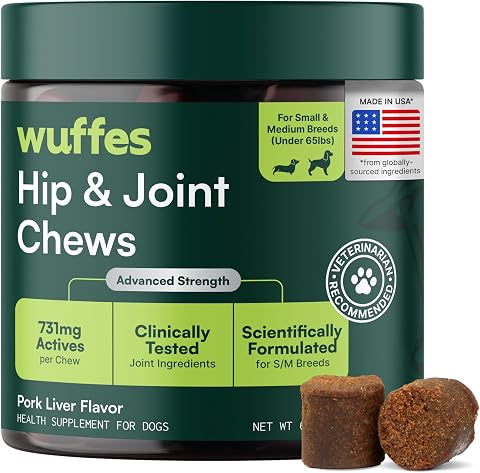
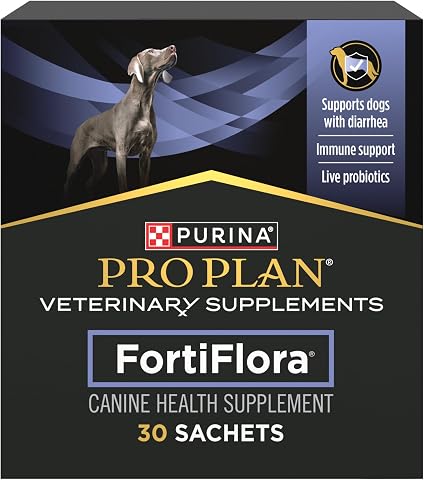
Nutramax's two joint products alone, Dasuquin and Cosequin, carry 19,059 and 80,003 ratings between them, more than Native Pet and Zesty Paws combined. That's the real shape of "open": not empty, just fragmented across several large, specialized players rather than owned by one.
27,574 ratings for Zesty Paws against 16,058 for Native Pet: both are large, established brands, and neither holds close to a fifth of the category by clicks. Supplements are the one segment of the five here with real room for a new brand, not just for whoever undercuts the leader on price, but open doesn't mean easy: unlike human dietary supplements, products marketed as supplements for animals have no separate legal category under DSHEA. The FDA treats them as animal food or, depending on their ingredients and claims, as new animal drugs, regulated by the agency's Center for Veterinary Medicine together with state feed control officials, not the lighter rules a first-time seller might expect from the human-supplement aisle. The National Animal Supplement Council runs a voluntary certification on top of that, with independent audits, adverse-event reporting, and facility inspections every two years, and both brands we checked display it: Native Pet and Zesty Paws each reference NASC on their live listing. It's a real barrier to a fast, low-effort launch in this category, not a formality.
The open-market read comes with one more real number. Native Pet's own listing runs Subscribe & Save at a 10% discount, read directly from the page, not estimated. In a category where the top result holds under a fifth of clicks, a subscription mechanic is one concrete way an established brand defends repeat purchases against a shopper who's actively comparing.
Why this isn't just a trend piece
There's a real reason behind the demand, not just social media aesthetics. Per the Association for Pet Obesity Prevention, one in four dogs in the US is obese, and accounting for overweight-but-undiagnosed dogs too, 59% carry more weight than they should; the rate climbs to 40-45% in middle-aged and senior dogs. Studies have linked mild-to-moderate overweight status to reductions in median lifespan of up to 2.5 years in some dog breeds, and 32% of owners of an overweight or obese pet still describe that pet as "normal weight." Demand for activity trackers and exercise gear is being pulled by a real, if not always consciously recognized, health need, not fashion alone.
Pet humanization is the backdrop: 69% of Millennials and Gen Z consider a pet a family member, and the average US household spends $1,445 a year per pet. People are willing to pay for a dog's comfort and health the way they pay for their own, which is what turns a niche trend into durable demand rather than a spike.
The idea of a subscription dog social club isn't invented either. Skiptown, a membership-based chain of dog clubs, had 8,000 active memberships across three locations by mid-2026, a specific number rather than a concept. And Amazon itself sent a signal: in 2026 it extended Pet Days from two days to five (May 11-15) and posted record sales, close to $400 million in US pet product sales for the event, with food, treats and supplements gaining share faster than accessories.
What this means for a seller
The table below uses one metric not shown earlier: instead of the single leading listing's click share (the "Top-1 click share" numbers from the first table), it's the combined share held by the three most-clicked listings Amazon names for each query, a broader read on how locked-down a category is.
| Niche | Demand (SFR) | Top-3 click concentration | Suggested CPC | What it means |
|---|---|---|---|---|
| Interactive toys | 10,038 | 17.7% | $0.75–1.33 | Biggest demand, growing (+7%), cheapest clicks of the group |
| Puzzle toys | 16,152 | 29.0% | $0.90–1.77 | Strong recognized leader; differentiate on the toy's mechanic |
| Joint supplements | 29,035 | 34.5% | $4.00–9.13 | Mid-concentration but the most expensive clicks here; positioning has to justify the CPC |
| Treadmills | 38,839 | 44.1% | $1.00–1.68 | One clear leader with real assembly complaints, but demand down 24%; cheap clicks, shrinking pool |
| CBD | 47,445 | 39.9% | $2.37–4.15 | Highest concentration of the group; this market is largely decided |
| GPS trackers | 179,499 | — | $1.20–3.40 | Small demand, but the leading listing's purchase share beats its click share; trust beats ad spend |
The broader pattern holds with one correction: the wider and more obvious the product (toys), the bigger the demand and the cheaper the clicks, not the more expensive. Cost per click actually tracks the supplement side of this list, where the market is least concentrated but sellers are bidding hardest to be seen inside it. And treadmills are the one category where demand itself, not just competition, is working against a new entrant right now.
Where the demand is actually coming from
This trend didn't start on Amazon. It's moving through TikTok and Instagram first, which means the on-Amazon search and click data above is measuring demand after it's already been shaped off-platform, not from a standing start. Amazon has a free, purpose-built way to measure that path: Amazon Attribution tracks clicks, product views and purchases back to a specific external source, TikTok, Instagram, an influencer's own link. Sellers who measure that traffic through Attribution and are enrolled in Amazon's separate Brand Referral Bonus program, open to Brand Registered US sellers, can earn a credit averaging around 10% of the qualifying sales it traces to that outside traffic. In the category with the steepest suggested bids in this article, joint supplements, up to $9.13, a creator's link that sends a shopper who's already decided to buy is a materially cheaper path to the same sale than winning that shopper cold on a Sponsored Products auction.
What Google search adds
Everything above is Amazon-specific: people who already typed a query into Amazon's own search bar, close to purchase-ready by definition. Google Trends measures something different, general public curiosity, on or off Amazon, and it's a snapshot averaged over the whole window rather than a week-by-week series, so it can't confirm the treadmill decline or settle the toys disagreement above. What it can do is compare how much the public is searching for each topic in the first place.
"Dog cbd" leads general Google search by a wide margin, both on that index and on share of the group's combined interest (46%, against 22% for dog treadmill). That's a real tension with the Amazon-side data earlier in this piece, where "dog treadmill" (Search Frequency Rank 38,839) shows higher purchase-intent demand on Amazon's own platform than "dog cbd" (47,445). The likely explanation: a lot of general "dog cbd" search volume is informational, is CBD safe for dogs, is it legal, rather than shopping intent, while a query typed into Amazon's own search bar is close to purchase-ready by definition. Google interest and Amazon purchase intent are measuring two different kinds of curiosity about the same topic, not the same demand seen from two angles.
A rough budget matrix
Putting the demand, concentration, CPC and fulfillment cost together from everything above, in one place. The dollar figures are illustrative starting points based on those factors, not minimum capital requirements or a formula applied to the data:
| Budget and goal | Best fit here | Why |
|---|---|---|
| ~$10k, first Amazon launch | Interactive or puzzle toys | Cheapest clicks ($0.75-1.77), real and growing demand, low unit cost, no oversize fulfillment fees |
| $50k+, willing to fight for positioning | Supplements (joint, general, or CBD) | Room in the market (19-40% top-3 click concentration, not locked up), but the highest CPC here means the budget has to survive a longer ramp; NASC certification and Subscribe & Save infrastructure take real capital before the first sale |
| Not without your own manufacturing or a genuine design fix | Treadmills | One leader with a real, checkable weakness, but the category's own demand is down 24-35% by two separate tools, and Large Bulky/Overmax fulfillment fees stack on top of a $499 unit cost before a single ad is bought |
This isn't a recommendation to enter any of these blind, it's a read of what the data in this article actually supports, and it will go stale the moment the next month's numbers land.
We've already worked in this exact category
Not "we know how to run ads" in the abstract, but specifically pet supplies and pet supplements, on Amazon and on Walmart:
- Pet Supplements: from an invisible launch to $303,836 in sales — a brand launched from zero, no sales history, no reviews, in a category full of familiar names. 70% of the resulting sales were organic, at 17.87% TACoS.
- Pet Supplies: when the data disagreed with exact match — the client asked to migrate from broad to exact match; account-level data said that was wrong for this specific account. Reversing it lifted sales 97% while ACoS fell 15%.
- Walmart: the account had not failed, it had stopped moving — campaigns were still running, growth wasn't. Four months later: $84,830 in sales at 6.24× ROAS, $1.29 average CPC against a $2-3 category benchmark.
How this was checked
Search ranks and click/purchase shares are read directly from our own copy of Amazon's Brand Analytics search terms report, US, July 2026, the same source behind which Amazon categories are actually open and why the most-clicked result isn't always the most-bought one. Prices, ratings, review counts and every quoted review are read directly from live Amazon product pages, saved 30 September 2026, not paraphrased from a secondary source. Every product independently searched and saved for this piece turned out to be the exact top-1-by-click ASIN for its search term in our own data, an outcome we noticed rather than engineered. Market size figures come from named industry research firms, cited where they're used; the one viral figure that didn't check out is corrected in the open, not quietly dropped. Suggested CPC and search-volume trend come from a separate tool, our own Helium 10 Cerebro export for the same ten terms, 30 September 2026: demand and click concentration say who's winning attention, not what winning it costs, so a cost figure needed its own source rather than an estimate. Return rate, growth and average price for the four closest-matching niches come from our own Product Opportunity Explorer exports, a second independent source from Brand Analytics or Helium 10, which is why Explorer's steeper treadmill decline (-35.3%) is treated as confirming Helium 10's (-24%) rather than a stray coincidence, and why the toy-category disagreement between the two tools is shown rather than resolved by preference. This is a snapshot at one date: search ranks, category shares, suggested bids and Explorer's own niche metrics all move, and the next update follows the next export of each.
Common questions
How big is the dog fitness market on Amazon?
Smaller than social media suggests. A widely shared figure of '$150+ billion' for the pet fitness and wellness market does not appear in any industry report we could find. The real number close to it is the size of the entire pet products market, $165.6 billion in 2026. The fitness niche inside that is much smaller: pet fitness care is $7-8.6 billion, dog treadmills specifically are $100-120 million, pet wearables are $4.1 billion, and dog supplements are $3.3 billion.
Which dog fitness product category has the least competition on Amazon?
By click concentration, dog supplements: its three most-clicked listings together hold only 19% of clicks for 'dog supplements' (the single leader holds under 9% alone), meaning no single brand dominates. Interactive toys are also relatively open at 17.7% three-listing concentration, but that category also carries the highest search volume of the group, so competition is larger in absolute terms even at a similar concentration.
Which search term shows the strongest purchase share relative to click share?
'Dog gps tracker', by one specific measure. Its top result's purchase share (18.5%) is higher than its click share (14.1%), meaning that listing captures a disproportionately high share of purchases relative to its share of clicks, a sign of strong post-click performance or brand preference, not a directly measured conversion rate. It's a trust signal for a specific product, not a claim about the category's total size.
Is the PawPaw's dog treadmill worth buying?
Reviews are mixed on a specific point: dogs use it and like it, but multiple buyers report parts that needed manual adjustment to fit and instructions that were incomplete or wrong for their unit. At 4.4 stars from 90 ratings (checked 30 September 2026), it is the top-clicked treadmill in our own search data, not a universally frictionless product.
Should a new seller enter the dog treadmill category?
Only with a clear difference, and demand is working against it right now. The category is small ($100-120 million) with its three most-clicked listings together holding 44% of clicks on the core search term (the single leader, PawPaw's, holds 18.3% alone), that leader's own reviews name real assembly and instruction problems, and Helium 10's data shows search volume for 'dog treadmill' down 24% over its trend window, the steepest drop of any term in this article. Cheap clicks ($1.00-1.68 suggested CPC) don't offset a shrinking pool of searchers.
Is the most open category also the cheapest to enter?
No. Dog supplements has the lowest click concentration in this article (19%, the most room for a new brand) and also the highest cost per click ($3.34-7.48 suggested CPC), well above toys or treadmills. A fragmented market still means bidding against everyone else trying to fragment it further; 'open' describes market share, not advertising cost.
Published by UNITIX Agency, an Amazon growth agency and an Amazon Ads Verified Partner. More at unitix.pro/insights.
Check your own product
ASIN Inspector
Paste an ASIN or an Amazon product link. You get the price and Buy Box, rank and how it has moved, ratings, images and video, and the search terms the product is clicked on. Free, and it needs no access to your account.