
Clothing is the least crowded category on Amazon. It is also the one everyone calls saturated
Amazon publishes what people search for, but never which category the demand sits in. We attached a category to the top thousand searches in each of eight marketplaces. The order that came out is close to the reverse of the advice sellers are given.
By Mariya Tkach, Head of Marketing and Growth, UNITIX Agency
See more UNITIX in Google
Add UNITIX to your Preferred Sources.
Ask which category on Amazon is the hardest to enter and you will hear the same answers: supplements, skincare, anything in health. Ask which is easiest and nobody says clothing, because clothing is where everybody already is.
Amazon publishes enough to check this, but not directly. Its search terms report names the phrases people typed, their rank, and the three products shoppers clicked most on each phrase. It does not say which category any of it belongs to: the field that looks like a department holds one value per store, amazon.co.uk on all 172,246 British phrases.
So the category has to come from the products. For the thousand most searched phrases in each of the eight marketplaces we work in, we looked up the products Amazon named and took the category from Amazon's own catalogue. A phrase belongs where at least two of its three products agree.
That gives one number per category that is worth more than it looks: the share of a phrase's clicks the three named products take. If it is high, three products are holding the search and a fourth arrives late. If it is low, the clicks are spread and there is a way in.
The answer in one list
United States, August 2026, the thousand most searched phrases. The figure is the median share of a search's clicks taken by the three products Amazon names on it: low means the clicks are spread, high means three products hold the search.
Least concentrated: clothing, shoes and jewelry 10.3%, computers and accessories 17.1%, tools and home improvement 17.7%, pet supplies 17.8%, arts, crafts and sewing 18.5%, cell phones and accessories 19.0%.
Most concentrated: video games 57.8%, industrial and scientific 38.6%, health and household 35.8%, office products 32.4%, beauty and personal care 31.5%, electronics 31.3%.
Video games is the exception explained at the end: eleven phrases, and the biggest is a console. The other five at that end are markets.
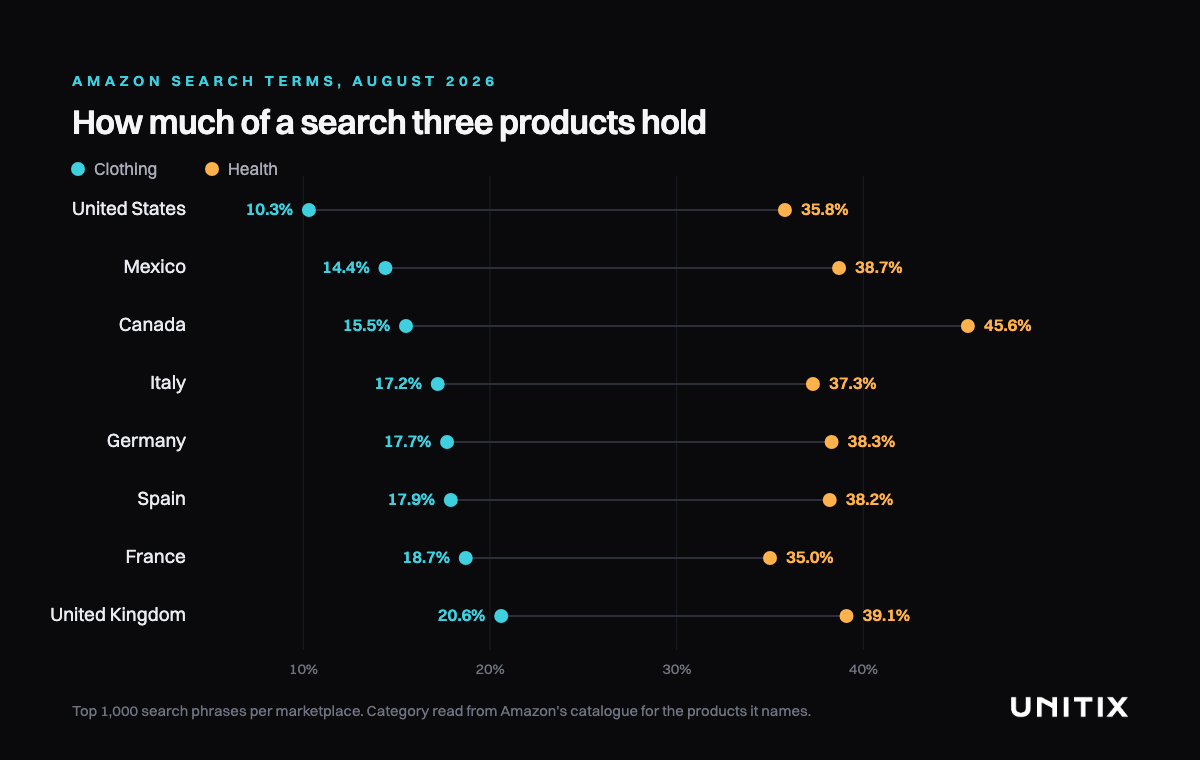
Clothing is the most open category in all eight marketplaces
| Marketplace | Share the top three take | Phrases | Click leader is not the buy leader |
|---|---|---|---|
| United States | 10.3% | 88 | 44% |
| Mexico | 14.4% | 148 | 38% |
| Canada | 15.5% | 77 | 31% |
| Italy | 17.2% | 102 | 40% |
| Germany | 17.7% | 104 | 29% |
| Spain | 17.9% | 120 | 37% |
| France | 18.7% | 68 | 38% |
| United Kingdom | 20.6% | 45 | 40% |
Eight markets, eight times the same answer, and the second column says it is not a small corner of the market: in Mexico 148 of the thousand biggest searches are clothing, in Spain 120, in Germany 104.
The last column is the part worth sitting with. In clothing, the product that wins the clicks is not the product that wins the purchases between a third and a half of the time. People look at one thing and buy another. Whatever is holding the top of a clothing search is not holding the sale.
Health and beauty are the most closed, in all eight
| Marketplace | Health | Beauty |
|---|---|---|
| Canada | 45.6% | 37.8% |
| Spain | 38.2% | 39.9% |
| United Kingdom | 39.1% | 35.4% |
| Mexico | 38.7% | 36.8% |
| Germany | 38.3% | 33.3% |
| Italy | 37.3% | 33.6% |
| United States | 35.8% | 31.5% |
| France | 35.0% | 34.8% |
In Canada, three products take 45.6% of the clicks on the average health search in the top thousand. Nearly half. And unlike clothing, the click leader in health usually is the buy leader: 21% disagreement in Canada, 14% in the United States, 6% in Britain. The first click tends to end the search.
This is the category new sellers are pushed towards, on the argument that margins are good and the product is small and light. Both of those are true. It is the third thing, the one nobody measures, that decides whether the first two ever matter.
The biggest category is not the most closed one
The largest category by number of top searches is the same everywhere, and it is neither of the two above.
| Marketplace | Home and kitchen phrases | Share the top three take |
|---|---|---|
| Canada | 240 | 25.6% |
| France | 225 | 24.3% |
| Italy | 200 | 26.3% |
| Mexico | 199 | 23.5% |
| Spain | 193 | 25.2% |
| Germany | 168 | 24.4% |
| United Kingdom | 160 | 24.8% |
| United States | 116 | 20.7% |
Between a tenth and a quarter of the biggest searches on every marketplace are home and kitchen, and the concentration sits in a narrow band around a quarter on all eight. It is the largest room in the building and it is not full.
What the two numbers do together
Read them as a pair and they sort categories into four kinds.
Closed, and the first click decides. Amazon's own devices, where a search for kindle returns Amazon's answer. Nothing to do here, and no advertising budget changes it.
Closed, but people compare. Electronics and office supplies sit here: three products hold a third of the clicks, and a quarter to a third of the time somebody else takes the sale. Visibility is expensive and worth buying only where the listing can win the comparison it starts.
Open, and the first click decides. Pet supplies in several markets: 17.8% in the United States, 20.9% in Britain and Canada, and a low disagreement rate. Getting seen is most of the work.
Open, and people compare. Clothing everywhere, home and kitchen everywhere, toys in most markets. This is where advertising does what it is supposed to do: the clicks are not owned, and being seen is not the end of the argument.
The obvious objection, and what it turned out to be
A garment lives on Amazon as many listings, one per size and colour. So the natural challenge to all of this is that clothing only looks open: if the three products Amazon names are three variations of the same thing, the clicks are spread on paper and one seller holds the shelf.
Amazon's catalogue answers it, because a variation names its parent. Across the thousand largest United States searches, two of the three named products share a parent on 20.7% of clothing phrases, and all three on 3.4%.
| Category | Two of the three share a parent |
|---|---|
| Amazon Devices & Accessories | 77.8% |
| Video Games | 54.5% |
| Sports & Outdoors | 52.4% |
| Computers & Accessories | 40.0% |
| Electronics | 29.4% |
| Health & Household | 22.4% |
| Clothing, Shoes & Jewelry | 20.7% |
| Home & Kitchen | 17.5% |
| Beauty & Personal Care | 15.5% |
| Toys & Games | 8.3% |
Clothing sits below health and household, and far below every category we called closed. So the objection does not hold, and the correction runs the other way: where variations really do collapse three products into one seller it is in the closed categories, which means their concentration is understated above rather than clothing's overstated. The distance between the two ends of this table is wider than the first table shows.
One reading did not survive the check. Sports and outdoors looked open at 25.8% in the United States, and on 52.4% of its phrases two of the three products are the same product in another size. It belongs with the categories where a single seller holds more than the number suggests, not with clothing.
What to check before entering a niche
Competition on Amazon is usually counted in sellers. These two figures count something a seller can act on instead.
The share the top three take is the price of being seen. At 40% a fourth product arrives late and pays for every visit; at 15% the clicks are spread and visibility can be bought.
The share of searches where the click leader is not the buy leader is what happens after the click. High, and the shelf is decided again on the listing: price, reviews, images, the offer. Low, and the first click usually ends it.
Neither of these is a reason to enter a category on its own, and open is not the same as easy. Amazon's own Product Opportunity Explorer prices the difference. For Clothing, Shoes & Jewelry in the United States it lists 500 niches with a return rate attached, and the median across them is 5.0%. Garment niches run at a median of 7.7% and footwear at 7.5%, while the rest of the same category, the jewellery, bags, sunglasses and watches, sits at 4.2%. At the top of the list: prom dresses at 31.8%, evening gowns at 29.4%, white dresses at 27.7%.
That is the price of the open shelf, and it is charged after the sale rather than before it. It also explains some of the openness: where a quarter of what ships comes back, nothing holds the top of a search for long. In the same 500 niches the pattern runs together, with a median of 148 products taking the clicks in garments against 86 in jewellery and accessories.
So what these two figures answer is narrower than where to sell, and still worth having: whether the traffic can be reached, and whether the sale is still in play once it is. What happens to the sale afterwards is a third question, and in clothing it is the expensive one.
Neither number is search volume, and neither is a count of competitors. A category where both are favourable is open in the two senses that decide whether a launch works: the traffic is available, and the sale is still winnable once it arrives. Clothing is the clearest case of that on all eight marketplaces, and it is the category everyone calls saturated.
What this does not say
The measurement covers the top thousand phrases per marketplace, which is the head of demand, not all of it. Deeper in the tail concentration rises: on the full United States report for July it went from 27.6% on the top thousand phrases to 35.5% beyond rank 500,000. So these figures describe the busiest searches in each category and understate what a small phrase looks like.
The category comes from the products, not from the phrase, and about 3% of phrases had three products that did not agree with each other. Those are left out rather than forced into one. Films, television and books are left out too: 157 phrases in Britain, 183 in Germany. Three titles take three quarters of the clicks on a film, which says something about films and nothing about a market anyone can enter.
Amazon's category names differ by marketplace, and so do the categories themselves. Britain separates lighting from home, Spain separates portable speakers from electronics. The tables above group what Amazon groups, in each market's own terms.
One kind of row reads differently and is worth naming. Video games sit near the top of concentration in every marketplace, but on eleven to thirty-three phrases, and the biggest search is a console or a single title. There is one PlayStation 5, and its share of a search says nothing about a shelf anyone can join. A category holding a hundred and sixty phrases is describing a market; one holding a dozen is describing a product.
And one figure is a snapshot. Whether the three products holding a category this month are the same three next month is a different question, and a better one. We started keeping the data to answer it in October.
Published by UNITIX Agency, an Amazon growth agency and an Amazon Ads Verified Partner. More at unitix.pro/insights.
Check your own product
ASIN Inspector
Paste an ASIN or an Amazon product link. You get the price and Buy Box, rank and how it has moved, ratings, images and video, and the search terms the product is clicked on. Free, and it needs no access to your account.