
On one search in four, the most-clicked product is not the one people buy
Amazon names the three most-clicked products for every search term and reports click share and purchase share separately. Comparing the two across 676,386 complete sets shows the click leader losing the purchase lead on 23.5% of terms, and finishing last of the three on 10.9%.
By Mariya Tkach, Head of Marketing and Growth, UNITIX Agency
See more UNITIX in Google
Add UNITIX to your Preferred Sources.
For every search term it reports, Amazon names the three products shoppers clicked most, and gives two numbers for each: its share of that term's clicks, and its share of that term's purchases.
Two numbers for the same three products invites an obvious question. Are they the same ranking?
Often they are not.
The click leader loses the purchase lead on a quarter of searches
We took the United States search terms report for July 2026 and kept every term where all three named products report a real purchase share and no two are tied on clicks. That leaves 676,386 complete sets to compare.
| Sets | Share | |
|---|---|---|
| Click leader is also the purchase leader | 517,266 | 76.5% |
| Click leader is beaten on purchases | 159,120 | 23.5% |
| Click leader finishes last of the three on purchases | 73,505 | 10.9% |
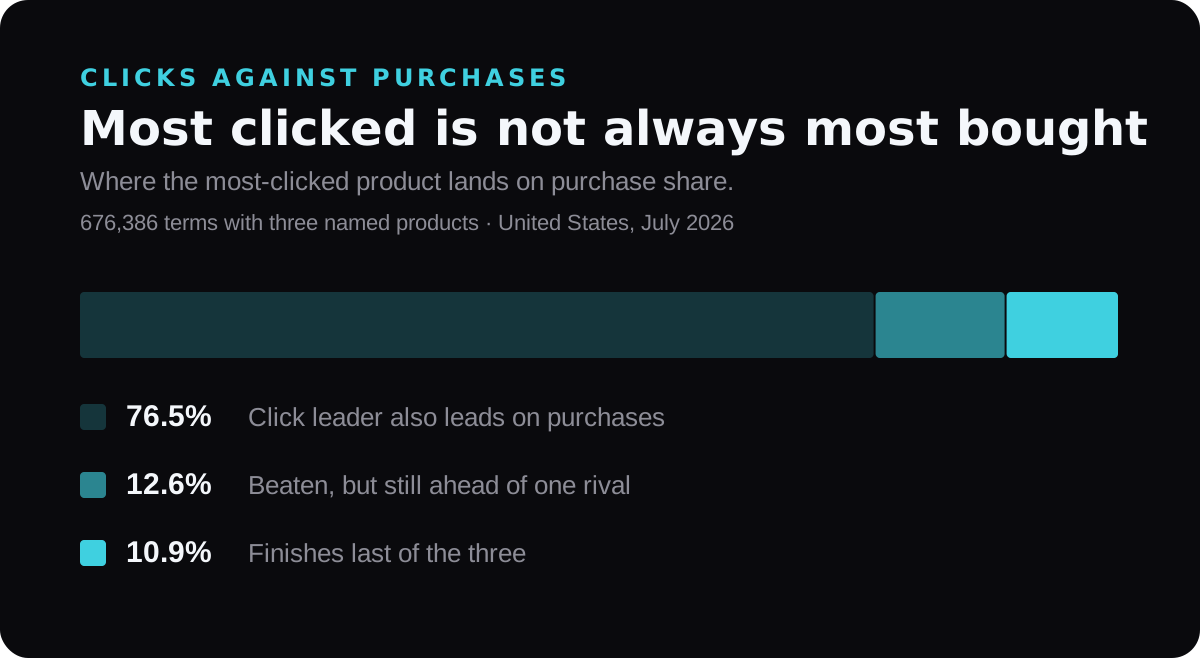
When the leader is beaten, it is usually not close. The product that actually leads on purchases takes a median 1.62 times the click leader's purchase share, and at the ninetieth percentile four times it.
The rate barely moves with how popular the search is: 25.4% on the thousand most-searched terms, 22.9% out beyond rank half a million. This is not a quirk of thin data in the tail. It is how Amazon search behaves everywhere.
Why this comparison is worth trusting
There is a trap in this data that is worth naming, because avoiding it is the reason the numbers above are shaped the way they are.
Amazon picks the three products it names by clicks. So the group is selected on one metric and measured on another, and any such group will look worse on the second one. Comparing the named three against the market as a whole would produce a large, impressive and entirely meaningless gap.
Comparing the three against each other does not have that problem. All three were chosen the same way, on the same term, in the same month. When one of them converts its attention into purchases better than another, that difference is about the products, not about how the sample was drawn.
That is also why terms with a reported purchase share of zero are excluded rather than counted as failures. Those records cluster in the tail, rising from 13.5% of the top thousand searches to 31.4% past rank 500,000, which is what rounding looks like when the underlying purchase counts are small. Reading them as products that sell nothing would have produced a much more dramatic article and a wrong one.
What being the clicked-but-not-bought product means
If your product is the one Amazon names as most clicked and another is taking the purchases, the search is not the problem and advertising will not fix it. You are already winning the part that advertising buys.
Shoppers are finding you. They are choosing you over the alternatives on the results page, which means the image, the title and the price are doing their job. Then they open the page and buy something else.
What sits between the click and the purchase is a short list: the images past the first, the bullets, the A+ content, the review count and rating against the competitor beside you, the price once delivery is included, and the delivery date itself. One of those is losing an argument the results page had already won.
Spending more on ads in this position makes the loss bigger, not smaller. You are paying for more clicks to a page with a known conversion problem.
What it means when you are the other one
The reverse case is more encouraging and more actionable.
If you take fewer clicks than a rival but more purchases, your page converts better than theirs. The gap is in the results page: the main image, the title, the price shown in the grid, the rating stars, the badge. Those are cheap to test and fast to change, and every extra click you win arrives at a page you already know performs.
That is the situation where more advertising is straightforwardly a good idea.
How to check your own
Amazon gives you the same two numbers it gave us, for any term where your product is one of the three named. The check is:
Find the terms where you are named. If you are not named, this comparison is not available to you and the first job is ranking, not conversion.
Put your click share next to your purchase share, then next to the other two products on that term. Not against a category benchmark, and not against your own history. Against the two competitors selected the same way you were, in the same month.
If your purchase share is the lowest of the three while your click share is the highest, you have a page problem with a number attached to it, which is a rare and useful thing to be able to say to a designer or a copywriter.
Then look at what the other two do that you do not. They are named, so you can open them.
The limits
This is one month in one marketplace, and it counts clicks and purchases as Amazon reports them, in share form rather than in units.
It only covers products Amazon names, which is three per term. A product taking a healthy share of purchases without appearing in the top three by clicks is invisible here.
And a gap between the two numbers is a signal to investigate, not a diagnosis. A product can sit below its click share on purchases because it is genuinely worse, because it is more expensive for a good reason, or because it is the one people click to compare against the one they were always going to buy.
Our ASIN inspector runs this comparison for a product: the terms it is named on, its click share and purchase share side by side, and the same pair for the other two products on each term. The Amazon keyword tool does it the other way round, starting from a phrase and showing all three.
A vivid, visible example of the same gap: a Halloween pen set leading two different countries' search results while outselling its own click share, pulled from the same kind of report.
Published by UNITIX Agency, an Amazon growth agency and an Amazon Ads Verified Partner. More at unitix.pro/insights.
Check your own product
ASIN Inspector
Paste an ASIN or an Amazon product link. You get the price and Buy Box, rank and how it has moved, ratings, images and video, and the search terms the product is clicked on. Free, and it needs no access to your account.