
Halloween Decorations Were Already a Top-15 Amazon Search, a Month Before the Holiday
Amazon's own September 2026 search data, across all eight marketplaces: "halloween decorations" was already the 11th most-searched phrase on Amazon US, a full month before Halloween. Here's what's actually behind the searches, with real products, real prices, and one pen set that outsells its own click share.
By Mariya Tkach, Head of Marketing and Growth, UNITIX Agency
See more UNITIX in Google
Add UNITIX to your Preferred Sources.
Amazon's September 2026 search data, pulled fresh for UNITIX's monthly report, turned up something that didn't fit that report: "halloween decorations" was already the 11th most-searched phrase on all of Amazon US, ahead of nearly every other product category that exists, a full month before October even started. That's not a Halloween estimate or a seasonal model. It's Amazon's own Search Frequency Rank, read the same way our keyword research is read every month.
So we went looking at what's actually behind the searches, across all eight Amazon marketplaces: the real products, their real prices, and in one case, a strange gap between what gets clicked and what gets bought.
What's winning the search, and what's actually selling
In the US, the single most-clicked product behind "halloween decorations" (Search Frequency Rank #11) is a $15.99 inflatable-style spider web decoration from a brand called OCATO: a 200-inch web with a nearly five-foot spider. Amazon's own listing badge, read live in early October, already says 30,000+ bought in past month.
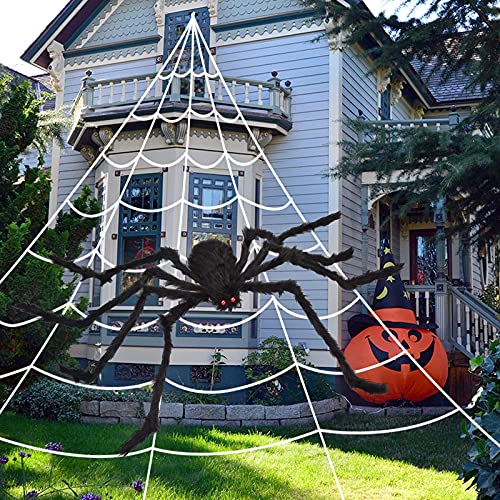
$15.99, 30,000+ bought in past month. Image: Amazon.
The second-placed product for the same search, solar LED Halloween string lights from DenicMic at $27.99, sits at a reported 10,000+ bought in past month, a third of the leader's badge despite a similar click share. Two products competing for the same search term, and the cheaper, more visually dramatic one is pulling ahead by a wide margin.
The pattern doesn't look the same in every country
We pulled each marketplace's highest-ranked clearly-Halloween phrase the same way. The mix of what people are actually searching for changes a lot by country, even this early:
| Marketplace | Leading phrase | Search Frequency Rank | What's behind it |
|---|---|---|---|
| United States | halloween decorations | #11 | Giant spider web decor |
| Canada | halloween decor | #23 | Hanging ghost decorations |
| United Kingdom | halloween decorations | #48 | Indoor banner and bunting set |
| Germany | halloween deko | #45 | LED hanging bat decorations |
| France | legami halloween 2026 | #68 | Branded stationery gift set |
| Italy | legami halloween 2026 | #692 | Same stationery gift set |
| Mexico | disfraz halloween mujer | #60 | Women's costume |
| Spain | disfraz halloween niña | #300 | Girls' costume |
North America, the UK and Germany are searching for decor first. Mexico and Spain are already searching for costumes. And two European markets are both led by the exact same product, which is where this gets interesting.
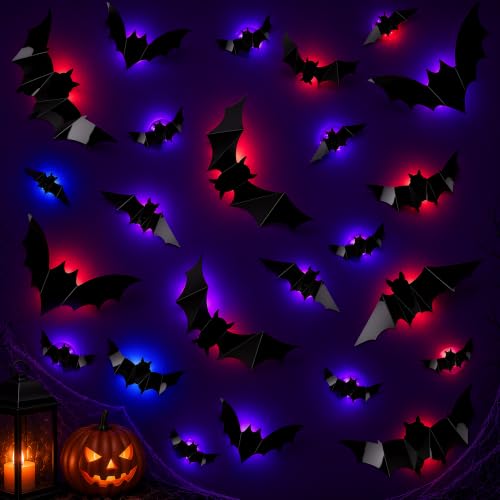
Germany's second-placed product for "halloween deko": LED bat decorations, €15.99. Image: Amazon.
The strangest find: a pen set that outsells its own clicks
In both France and Italy, the top result for "legami halloween 2026" is the exact same product: a €12.45 erasable-pen gift set from the Italian stationery brand Legami, packaged as a glow-in-the-dark "Spooky Party" set.
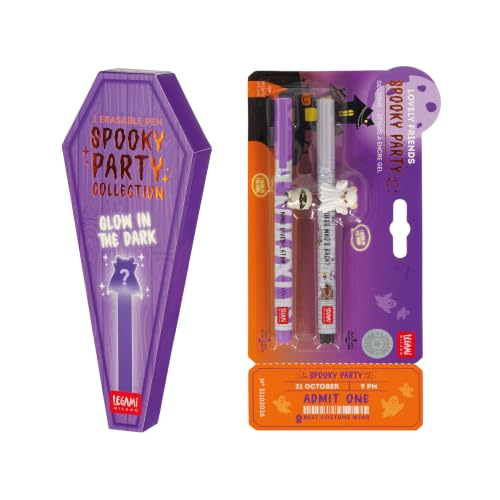
€12.45, the same product leading the search in both France and Italy. Image: Amazon.
What's unusual is the gap between its two Brand Analytics numbers. In France, it holds 52.95% of the click share for that search term, but 71.03% of the purchase share. In Italy: 55.15% of clicks, 65.82% of purchases. In both countries, shoppers who land on it buy it at a noticeably higher rate than they click away to compare the other two products Amazon names for the same search.
That's not a fluke specific to pens. We found the same pattern holds across the board: the most-clicked product is not the most-bought one on close to a quarter of all Amazon search terms. This is just a vivid, visible example of it, sitting on top of two country's Halloween searches at once.
Curious whether your own product, or a competitor's, shows the same gap, Halloween or not? Our free ASIN Inspector runs this exact comparison: paste an ASIN and it pulls its click share and purchase share from Amazon's own report, side by side with the other two products named on the same search term.
What this means for a seller
UNITIX's take
None of this is a forecast, and we're not going to pretend a single September tells you what October looks like. What it does tell you: for a seasonal category, "the month before" is not early. Search Frequency Rank in the teens and forties, for product searches rather than brand or media searches, is genuinely substantial volume, and listings that aren't live and well-stocked by the time a shopper searches don't get a second chance at that specific demand spike. If you're weighing whether a seasonal listing is worth the campaign spend to launch on time, that's exactly the kind of call our Amazon PPC management work makes with clients every quarter, not just at Halloween.
Amazon's own monthly numbers, for every marketplace and every month, not just the seasonal spikes, are in our free monthly Amazon search report.
Common questions
Where does this data come from?
Amazon's own Brand Analytics Search Terms report, the same source behind UNITIX's monthly Amazon search report. It ranks every search phrase by Search Frequency Rank (lower number means more searched) and names the three most-clicked products behind each one, with their click share and purchase share. We pulled it for all eight Amazon marketplaces for September 2026, the most recent complete month at publish time, and looked specifically at Halloween-related phrases rather than each marketplace's single biggest search.
Is Halloween search bigger this year than last year?
We can't say, honestly. UNITIX started pulling this report in July 2026, so September 2026 is the only Halloween-season data we have of our own. What we can say is what the numbers show right now: Halloween decor and costume terms were already ranking inside the top hundred searches on most marketplaces a full month before the holiday.
What does "bought in past month" actually mean?
It's Amazon's own listing badge, not a UNITIX estimate. Amazon shows it in rounded thresholds ("30,000+ bought in past month") rather than an exact count, and it's a rolling 30-day figure read live, not a fixed calendar month. We read it in early October, so it already reflects some pre-Halloween buying, not just September.
Why does the same pen set lead the search in both France and Italy?
Because Amazon's Brand Analytics report names the three most-clicked products for a search term and gives each one two separate numbers: click share and purchase share. For this term, the top product's purchase share runs well above its click share in both countries, meaning shoppers who see it buy it more often than they click away to compare it against the other two. We cover this click-versus-purchase gap in general, across 676,386 search terms, in a separate article.
Does this mean I should list Halloween products right now?
That's a sourcing and timing decision specific to your supply chain and account, not something a search rank alone answers. What the rank does tell you is that demand for these phrases was already substantial before October started, which matters for how early you'd need to have inventory and a live listing to catch it.
Published by UNITIX Agency, an Amazon growth agency and an Amazon Ads Verified Partner. More at unitix.pro/insights.
Check your own product
ASIN Inspector
Paste an ASIN or an Amazon product link. You get the price and Buy Box, rank and how it has moved, ratings, images and video, and the search terms the product is clicked on. Free, and it needs no access to your account.