
Pet Supplements
Pet Supplements: from an invisible launch to $303,836 in sales
The brand arrived with no sales, reviews, or organic rank in a category full of familiar names. Across the measured period, 70% of sales were organic.
Period: 1 April 2025 to 22 July 2026, full accountAmazon PPC Management

Results
Total sales
$303,836
Ad-attributed sales
$91,243
TACoS
17.87%
Total orders
14,399
Ad orders
4,394
Ad conversion rate
12.37%
Ad spend
$54,308
ACoS
59.52%
Ad impressions
6,890,940
All changes measured against a standing start: the brand launched in late 2024 with no sales history.

Run by Serhii Khyshchenko.
Why no brand name. The client is under NDA. The category, the launch window, and the account figures are exact; the brand and its ASINs are not named.
A new pet supplements brand arrived on Amazon with nothing the marketplace rewards at the start: no sales history, no reviews, and no organic rank. Around it were competitors buyers already recognised, with years of sales and category history behind them.
The quickest way to look established would have been to spend aggressively and buy visibility. High CPCs made that an expensive shortcut, and the brief ruled it out: build profitable growth, not a launch that only looks healthy while the advertising stays on.
Where the account ended up
Between April 2025 and July 2026, the account produced $303,836 in total sales across 14,399 orders, at a TACoS of 17.87%. For a brand that began without a single marketplace advantage, the revenue is only the first half of the result.
Advertising contributed $91,243 of that directly, from 4,394 ad orders at a 12.37% conversion rate.
The figure that matters most
70% of sales came in organically. 30% came from PPC.
That split is what changed the position of the brand. At launch, paid traffic had to introduce a product Amazon shoppers had no reason to find on their own. Across the measured period, most sales did not need an ad click. Advertising supported the account without becoming the only thing keeping it visible.
How the spend was distributed
87.8% Sponsored Products, 12.2% Sponsored Brands.
Most of the spend went to the format closest to purchase intent, while a smaller share gave the unfamiliar brand room to be seen and remembered. The order mattered: prove that the product can convert before asking advertising to build recognition around it.
69.1% of sessions were mobile. The listing may be built on a desktop, but this brand was being judged mainly on a phone, where every image and line of copy has less room to earn trust.
What the curve shows
The first two months of the chart are almost flat. Sales begin in June, rise sharply, pull back, and then keep rebuilding through the following year. It is not a perfect upward line, which is precisely why it reads like a real launch rather than a retrospective success story.
ACoS spikes hard when the launch begins and later settles into the 50–60% band. Read alone, that number looks uncomfortable. Read beside a 17.87% TACoS and a sales mix that became 70% organic, it shows paid advertising doing the expensive early work without remaining the whole business.
The quiet number
40 refunds against 14,399 orders.
Fast sales can hide a product customers do not want to keep. Here, the quiet number supports the loud ones: 14,399 orders did not turn into a returns problem waiting to surface later.
The dashboard
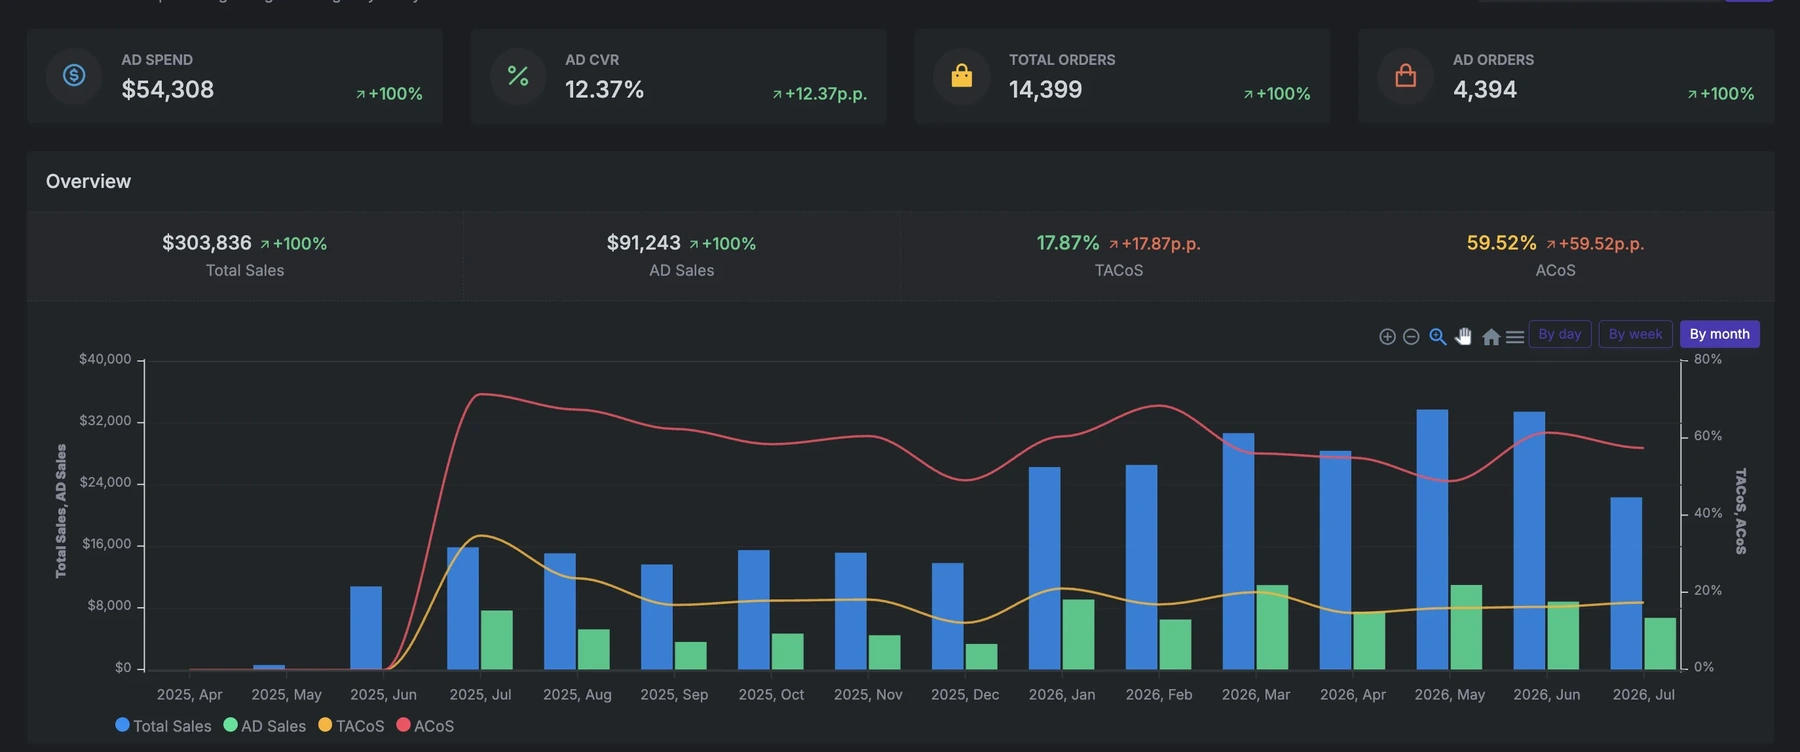
The account in UNITIX SOFT, April 2025 to July 2026. Total sales, ad sales, TACoS and ACoS by month. The launch curve begins in June 2025.Open full size