
Medical Supplies & Equipment
Medical supplies: $590K in sales and a Best Seller badge
Eleven months of active work on one product: exact-match foundations, then wider targeting and Amazon audiences. $590K in sales, more than 27,000 units, $91K net profit and a Best Seller badge in its subcategory.
Period: October 2025 to October 2026; active work from December 2025Amazon PPC Management, Listing Design
Results
Sales, October 2025 to October 2026
$590,270
Units sold
27,418
Net profit
$91,450
Ad sales
$441,754
ACoS 35.8%, TACoS 26.8%
Sales in October 2026
about $90,000
Net profit in October 2026
over $16,000
Subcategory
Best Seller badge
All changes measured against the period's own totals; no before-and-after percentages are claimed.

Run by Viktoriia Moroz.
Why no brand name. The client is under NDA, so the brand and product are not named. The category, the engagement window and the figures are exact.
We started active work on a product in Medical Supplies & Equipment at the end of 2025. The job was more than buying traffic for it: we needed an advertising system we could control, the keywords that actually convert, a stronger listing, and a base that could take more budget later.
The goals we set were to grow sales and orders, improve visibility on the main searches, strengthen the product against competitors, lift conversion on both the listing and the ad traffic, scale campaigns while keeping ACOS and TACOS under control, and reach the top of its subcategory.
What eleven months produced
- $590,270 in sales between October 2025 and October 2026, almost all of it after active work began in December
- 27,418 units sold
- $91,450 in net profit
- $441,754 in ad sales, at 35.8% ACoS and 26.8% TACoS
- About $90,000 in sales in October 2026, with net profit over $16,000 that month
- A Best Seller badge in its subcategory of Medical Supplies & Equipment
December to February: a structure we could read
The first months went into a controlled campaign structure and clean data. The base was Sponsored Products with exact match on the most relevant keywords, so the budget went to the searches with the clearest intent to buy and every keyword could be judged on its own numbers. We tested bid levels, search terms and placements, with particular attention to top of search.
The listing was worked on at the same time, because bringing a buyer to the page is only half the job. That meant the title and key listing elements, tests of the main image, A+ Content, ad banners, video creatives refreshed on a schedule, and Amazon promotions, coupons and discounts where they were available.
Ad sales, orders and visibility were already rising within the first months, which gave the next stage something to build on.
March to May: scaling by widening, not by bidding up
Once the best searches were known, budgets went up. The approach was to widen the reach rather than simply raise bids:
- Phrase and broad match found new converting searches, and the best of them moved into their own exact campaigns for tighter bid control
- Competitor targeting through product and category targeting, aimed at products we could compete with on price, features and the strength of the offer
- Brand defence on the brand's own ASINs, to hold the ad placements on its own product pages
- Sponsored Brands video and headline ads, run alongside Sponsored Products on the most important searches so a buyer met the product more than once
Sponsored Brands headline ads did especially well and became one of the main tools for scaling. Ad spend went from about $11,500 in March to $18,000 in May, and ad sales and total sales grew with it.
Amazon audiences
With the core structure in place, we started bidding on who the shopper was, not only on what they searched for. We tested three of Amazon's audience segments: high interest based on shopping history, purchased the brand's product, and clicked or added the brand's product to cart.
The approach was low base bids with high adjustments for the chosen audiences. That kept broad reach affordable while competing harder for the shoppers most likely to buy. High interest based on shopping history did best, became one of the product's main sources of quality traffic, and stayed in the strategy as a core part of it rather than an experiment.
June and July: optimising what had grown
After months of scaling, the work turned to efficiency. Budgets moved between ad types, bids were tuned and wasted spend was cut, with the most attention on campaigns selling at an acceptable ACOS and on high-converting searches.
Creatives kept changing. The same banners and videos had been running for a long time, so they were refreshed and new versions tested, and the video was replaced several times over the engagement. Sponsored Display was tested too, but it did not perform well enough to scale, so it stayed mainly for defending the brand's own product pages and the budget went to Sponsored Products and Sponsored Brands.
August to October: holding the position
Ad spend peaked in August at about $23,700, the highest month of the engagement. From there budgets were managed more tightly: spend in September and October was lower than in August, while total sales kept growing. October brought about $90,000 in sales and over $16,000 in net profit.
The product also earned a Best Seller badge in its subcategory. That came from all of the work together: scaling the advertising, growing sales and visibility, using promotions, and improving the listing month after month.
What it shows
Scaling on Amazon is not the same as raising the budget. Here sales kept growing after ad spend came down from its peak, because the structure underneath was built to carry it: exact match first, then wider targeting, audiences with flexible bids, defence of the brand's own pages, and constant work on the listing and the creatives.
For another account in a related category, see the first aid case. How we run campaigns like these is on the Amazon PPC management page.
The dashboard
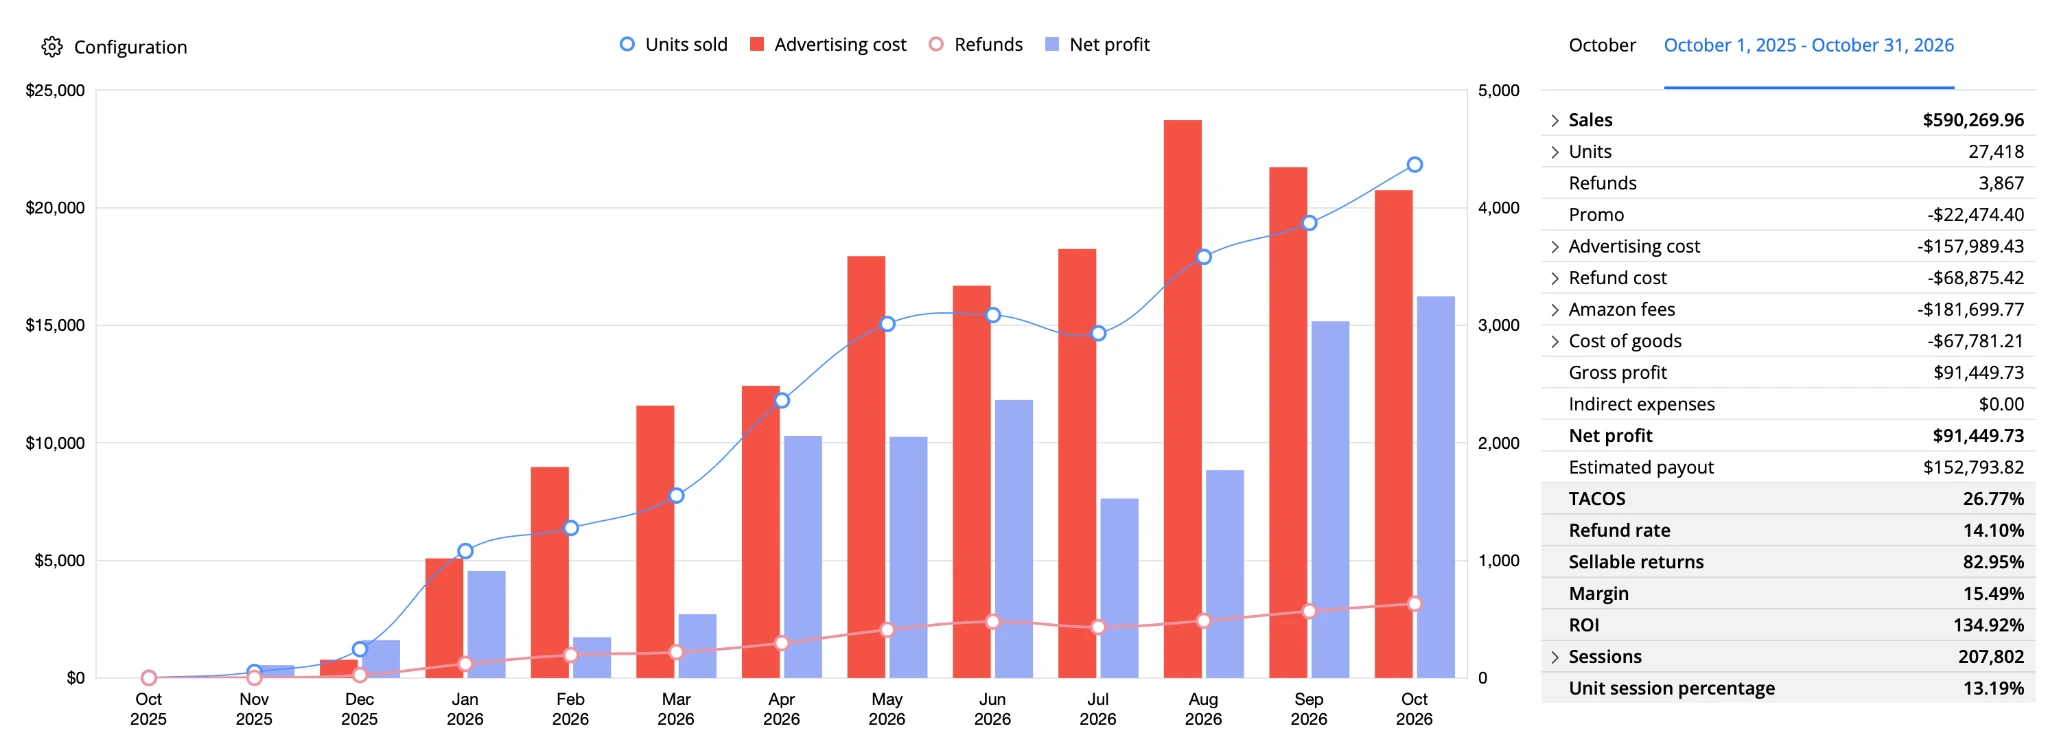
Profit report, 1 October 2025 to 31 October 2026, by month: units sold, advertising cost, refunds and net profit. Totals for the period: $590,269.96 in sales, 27,418 units, $157,989.43 in advertising cost and $91,449.73 net profit.Open full size 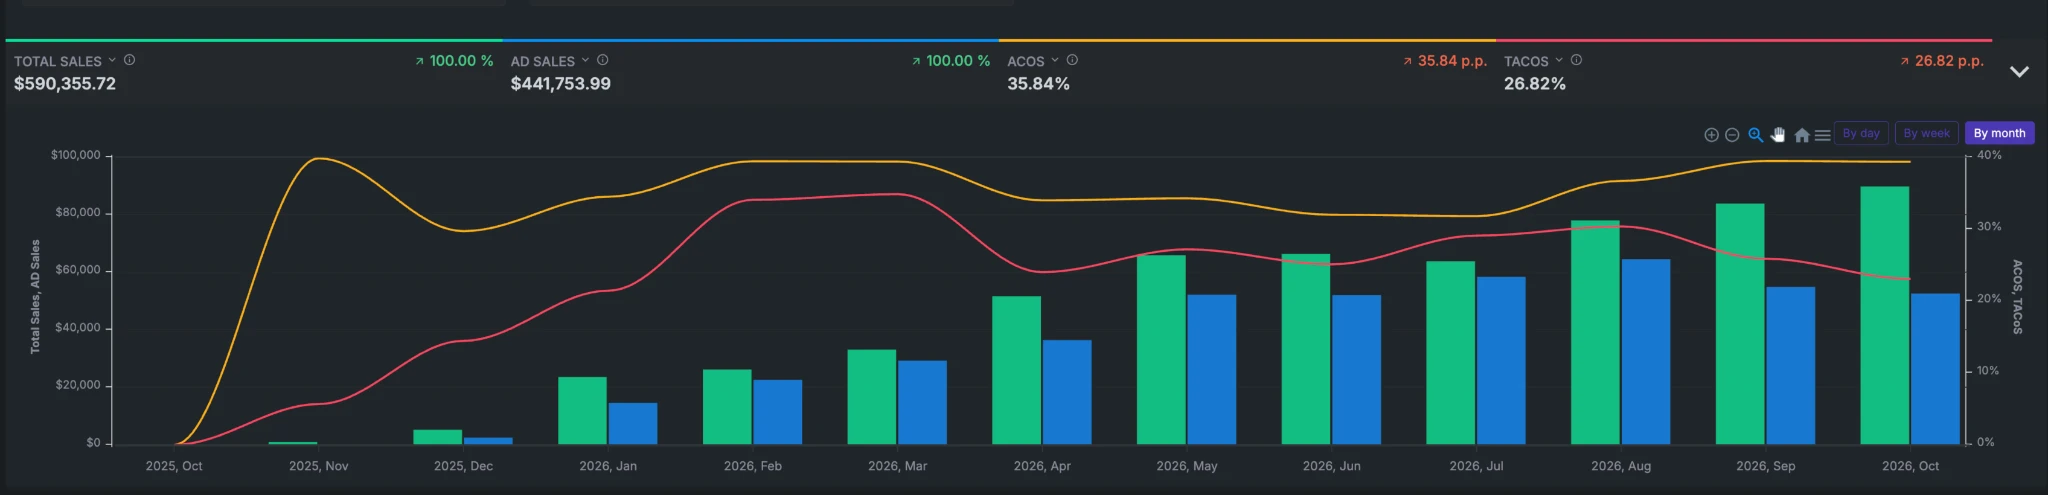
Total sales and ad sales by month over the same window, with ACoS and TACoS: $590,355.72 in total sales, $441,753.99 in ad sales, ACoS 35.84%, TACoS 26.82%.Open full size