
Home & Kitchen
Home & Kitchen: premium pricing, overstock, and 24.5% of the category
Inventory had to move, but discounting would erase the reason the product was premium. A year later, sales were up 8.3× and category share reached 24.5%.
Period: Twelve months, ending JanuaryAmazon PPC Management

Results
Sales over the year
8.3×
Profit
+477%
Category share
24.5%
↑ captured over the year
All changes measured against the account's own performance before the engagement.

Run by Denis Maximovich.
Why no brand name. The client is under NDA. The category, the twelve-month window, and the figures are given as recorded; the brand and its ASINs are not named.
The brief sounded simple: grow a premium product in Home & Kitchen. In practice, the account was being squeezed from four sides at once.
The category was already crowded with established players holding strong positions.
The product was priced above the market average. Genuinely differentiated, but expensive, which narrows the audience advertising has to find.
Low-cost competitors arrived mid-way, launching similar products at lower prices and increasing the pressure on every keyword.
There was an overstock problem. Excess inventory had to move before storage fees consumed more margin. The clock was running, but discounting too hard would teach buyers that the premium price was never real.
What we did
Audited every existing campaign first, to find where growth was actually available rather than assuming.
Restructured for control. High-frequency keywords were split into individual campaigns instead of sitting inside clusters where their performance was invisible. Previously clustered terms were expanded out and given room.
Widened targeting to include competitor ASINs, our own ASINs, and category placements, so the product appeared beside the alternatives a buyer was already comparing.
Focused on the variations that convert. Reviewing advertised variations by CTR and conversion rate showed where spend was being wasted on versions that browsed well and sold badly.
The result
Over the year, sales increased 8.3× and profit grew 477%.
The product ended the year holding 24.5% of its category, measured in Helium 10. Sales multiples describe what happened inside one account. Category share shows what happened while every cheaper competitor was fighting for the same buyer.
The dashboard
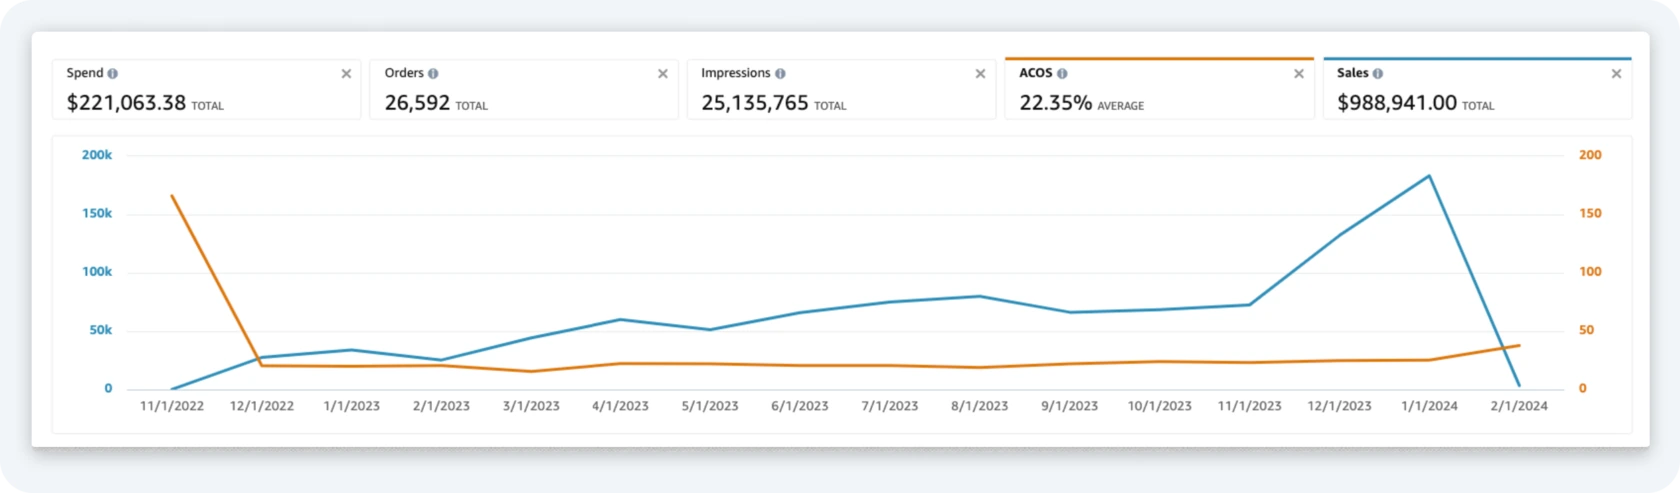
Spend, orders, impressions, ACOS and sales for the account across the engagement, from the account's own advertising dashboard.Open full size 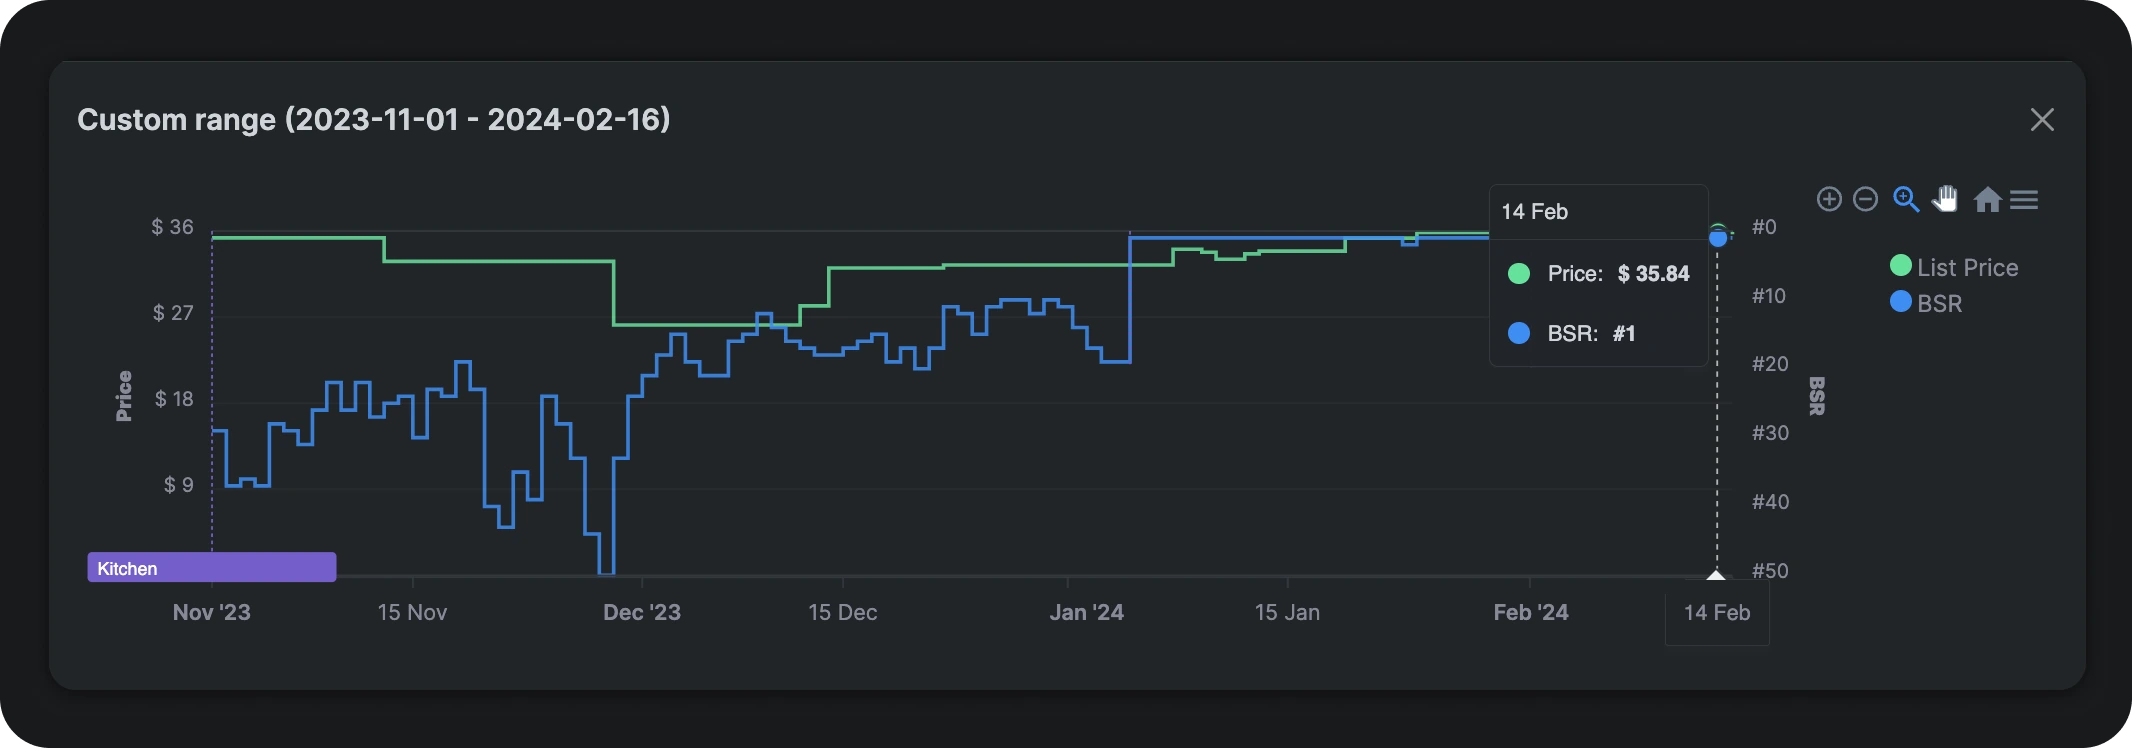
List price against Best Sellers Rank, November 2023 to February 2024. This shows rank and price only; it is not the source of the sales and profit figures above.Open full size